

The potential spillovers of the upcoming Fed decision
The potential spillovers of the upcoming Fed decision

It is Fed Day (again), and this month will be particularly interesting. At the start of the year, markets expected the Fed to start cutting interest rates right about now together with the Bank of England, the ECB and other important central banks. But with the US economy stubbornly refusing to acknowledge higher interest rates in the form of slower growth, June could be the month when the European banks cut rates while the Fed remains on hold. Time to investigate then what kind of spillovers we might get from the divergence of Fed policy in Europe.
If you look at the transatlantic difference in policy rates, it doesn’t matter if the Fed hikes interest rates while Europe stays put or if Europe cuts interest rates while the Fed stays put. In both instances, the gap widens in favour of the US leading to a stronger US dollar vs. the Euro, Sterling, and other European currencies. This is good news for exporters in Europe that ship to the US because they benefit from a windfall in their revenues and margins thanks to exports that appear cheaper to buy for Americans and revenues that get boosted in the exporters’ home currency thanks to a stronger dollar.
But the challenge in today’s world is not just to assess how exchange rates will fluctuate in response to the Fed’s decision today. That was the job of economists and investors in the 1980s and 1990s. Today, we live in a world of forward guidance and 24/7 financial news. Every utterance of a central banker, whether it is in the official statement, the press conference after the decision, or any speech or interview given, is scrutinised in detail. And every guidance Jerome Powell and his colleagues provide can move markets, not just in the US but also in Europe.
This is why research by economists from the European Central Bank is so fascinating and at the same time important to read. They examine the spillover from the Fed to international financial markets for both conventional monetary policy (i.e. rate hikes and cuts), as well as unconventional measures. They differentiate between three possible unconventional policy measures:
Forward guidance: What the Fed projects in terms of future interest rates through its dot plot
Large-scale asset purchase programmes (LSAP, i.e. quantitative easing and tightening)
Central Bank Information (CBI) provided in interviews, speeches and Congressional statements
The chart below shows the average market reaction for the US and advanced economies ex US (AEs) in bond markets, equities, and currencies. Nobody will be surprised to see that international markets react to the decisions of the Fed but not as strong (as a rule of thumb the effect is about half as large in international markets as it is in the US). What may be surprising to see is that unconventional policy measures trigger the same if not a larger reaction in markets than conventional rate hikes and cuts. In fact, in bond markets, unconventional measures trigger a bigger reaction than conventional ones. Only in equity markets is the actual rate cut or hike seemingly more impactful than forward guidance or large-scale asset purchases or sales.
Financial market impact of US central bank actions
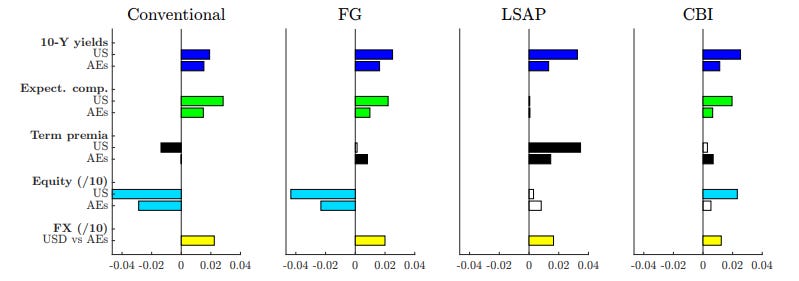
Source: Georgiadis and Jarocinski (2023). Note: FG = Forward Guidance, LSAP = Large-Scale Asset Purchases, CBI = Central Bank Information.
Thus, the first thing we need to remember is that we European better look for the forward guidance of the Fed today rather than whether they cut or not. What moves markets is the guidance, not the action.
The second thing we need to remember is that the transmission from the US to international markets is not through expectations for the real economy or anticipated changes in global trade due to a stronger dollar, etc. The analysis of the ECB shows that the transmission mechanism is through financial markets and the flows triggered by the Fed’s action. My second chart today shows the resulting changes in flows in international markets in the 12 months after a hawkish action by the Fed.
The charts on the left-hand side show that hawkish forward guidance by the Fed leads to immediate outflows from international equity portfolios as well as emerging market equity portfolios. Meanwhile, bond portfolios suffer only marginal and insignificant flows.
Quantitative tightening (shown in the middle column), on the other hand, triggers immediate outflows from international bond portfolios as investors chase higher yields in the US. But over time, it also led to outflows from international equity portfolios with maximum outflows in advanced country equity portfolios some eight months after the Fed announcement.
Finally, hawkish central bank information shown on the right-hand side creates all kinds of contradictory flows. The authors of the study think that what has been called central bank information is often not proactive guidance by Fed officials but instead a reaction of Fed officials to recent market events. Thus, they typically row back earlier comments and guidance which creates capital flows in the opposite direction of forward guidance or quantitative tightening. But admittedly, what exactly is going on there is a mystery to the authors of the study and needs further investigation.
Capital market flows in reaction to US central bank actions
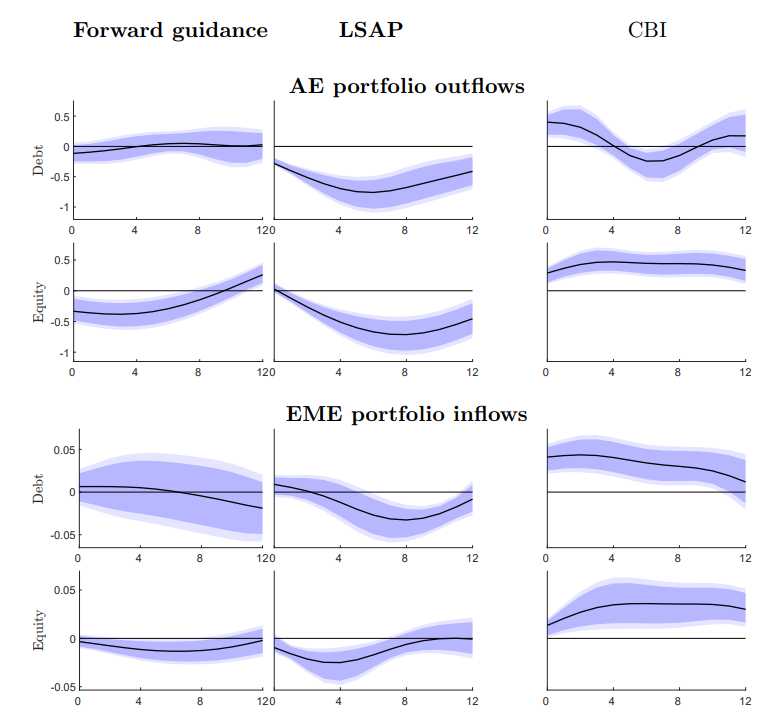
Source: Georgiadis and Jarocinski (2023). Note: FG = Forward Guidance, LSAP = Large-Scale Asset Purchases, CBI = Central Bank Information.
For today’s Fed meeting, we should focus mostly on the forward guidance by the Fed and any changes on the ongoing quantitative tightening programme. And we should be aware that if the Fed remains more hawkish than European central banks, the immediate effect will be felt through outflows from bond and equity portfolios that last several months, not just a couple of weeks. Knowing which stocks and bonds will face the largest outflows is thus crucial in the coming months.
Great post! I have to study it in depth
Excellent, detailed post -- thanks very muchly.
He is weird often enough, but I like to keep in mind Tom McClellan's claim that there is no need for the Fed, since interest rates follow the 2-year US Treasury yield index anyway, sooner or later.
With the fun observation that when the Fed undercuts the 2-year, it ends in a speculative bubble (1996-1998, 1999-2000, 2004-2006, 2009-2019). And that when the Fed overshoots, a recession is the result (2000, 2007-2008, 2023-2024). Hence, interesting times await us...
Here's the chart:
https://stockcharts.com/h-sc/ui?s=$UST2Y&id=p31063381237&p=D&a=1600097283&listNum=1