

+1–1 equals: anything from +1 to -1
+1–1 equals: anything from +1 to -1

One would think investors are good with numbers. But apparently, they are not even able to add up +1 and -1 correctly. In lab experiments as well as in real investment decisions, the result of +1 -1 depends heavily on the sequence of +1 and -1 investors have observed in the past.
It could well be that I already confused most of my readers, so let me give you a simple example. Imagine you invest in a company that reports quarterly earnings. For several years, the company beats its earnings estimates each quarter by 10%. Then, after five earnings beats, the company misses its earnings estimates by 10%. The sequence of earnings beats and misses is thus:
+10%, +10%, +10%, +10%, +10%, -10%
Now compare this to a company that misses earnings estimates by 10% each quarter for a year, then it beats estimates by 10% before missing again by 10%. The sequence of earnings beats and misses is thus:
-10%, -10%, -10%, -10%, +10%, -10%
Note that the last two quarters in the sequence are identical in both companies. Only the first four quarters are different.
One would expect that the difference in earnings surprises in the first four quarters influences the share price, but the last two quarters are a wash. Any gains in the fifth quarter due to the positive earnings surprise are lost in the sixth quarter after the earnings miss.
But unfortunately, both in lab experiments with this kind of stylised earnings results and in real life share prices, the second stock with the poor track record in the first four quarters will outperform the first stock in quarters five and six. In real life experiments one can estimate that the outperformance of the second stock over the first stock in quarters five and six will be some 3% to 5%.
Every experienced equity investor will know the story behind such events. The first stock shows a company that has strong “operational momentum”, i.e. its business is persistently outperforming expectations. After a while, investors start to expect this kind of earnings beat but when in the sixth quarter the company misses earnings estimates for the first time, investors think the magic of the company is gone and they sell the stock in large numbers creating a large drop in the share price.
The second company is a company that is in decline and constantly disappoints investors. After a while, investors consider the company a dud. It’s a bad business and everybody knows it is a bad business. So when in the fifth quarter the company presents surprisingly good numbers the share price jumps because this could be the start of a turnaround. The sixth quarter disappoints once again, but investors already knew the company was a dud, so who cares.
This is how adding and subtracting works in equity markets. Investors pay more attention to surprises that differ from past patterns than to surprises that match a previous pattern. In fact, the longer a pattern persists, the less the share price will react to it. If a company beats estimates every quarter for years, the share price will hardly react to another earnings beat. But if the company suddenly misses earnings, investors start to perk up and overreact to the recent news by selling the stock. Investor overreaction to the news that contradicts previous patterns pushes the share price away from a rationally derived fair value. Mentally, the earnings beat and the earnings miss simply have different weights in investors’ minds depending on what investors are used to from the company.
The chart below shows the average share price reaction to earnings announcements between 2009 and early 2020. The green lines show the share price reaction to a positive earnings surprise that is of similar magnitude as the previous earnings surprise while the red lines show the reaction to a negative earnings surprise of similar magnitude as the previous earnings surprise. Solid lines indicate that the earnings surprise is in the same direction as the previous earnings surprise (so the green solid line indicates companies beating earnings by the same degree as in the previous quarter and the red solid line indicates companies missing earnings by the same degree as in the previous quarter). Dashed lines indicate earnings surprises that are of the same magnitude but switch signs from the previous surprise.
Share price reaction to confirming and contradicting earnings surprises
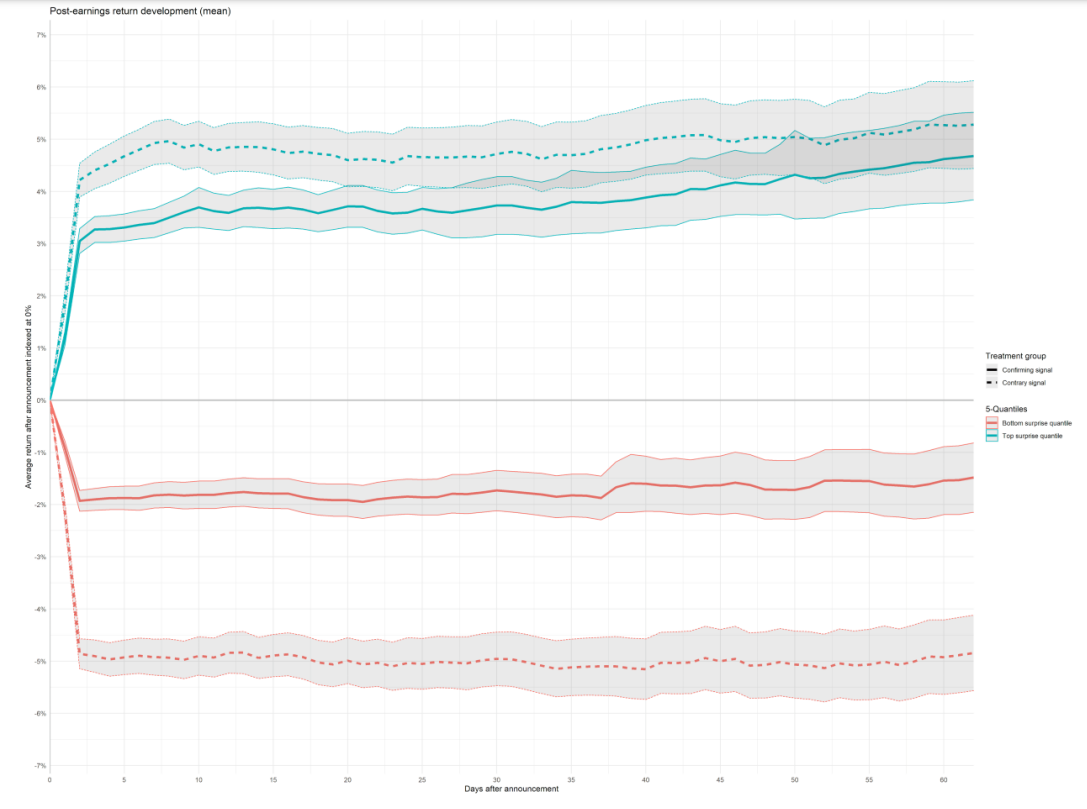
Source: Kieren et al. (2021)
The net share price reaction of the first stock described above would be the green solid line plus the red dotted line, in sum a roughly 1.5% drop in share price in the month or two after the earnings announcements. The net share price reaction of the second stock described above would be the green dotted line plus the red solid line, in sum a roughly 3% increase in share price. That’s a lot and makes a clear case for examining the historic pattern of earnings surprises of a stock when assessing the reaction to the latest announcement.
I wonder how much this has to do with companies sandbagging their expectations now. Apple under Steve Jobs started the trend but it has spread across all industries. It's quite common now for company's investor relations departments to call/pressure sell-side analysts to reduce their quarterly estimates. Hence making it easier to "beat" consensus estimates.