


Casting doubt on risk preferences

The human mind just never seizes to surprise me. And a new paper by Ryan Oprea from the University of California Santa Barbara made my head explode. He measured risk aversion with the lottery tasks we know for decades and that have widely been used in risk appetite questionnaires. And then he managed to get the same responses in a similar task that involves no risk or uncertainty whatsoever.
Oprea asked 673 volunteers to fill in questionnaires about what they would do when confronted with different choices. One setup is shown below.
The lottery setup to measure risk aversion

Source: Oprea (2024)
This is the classic approach to measuring risk aversion by giving people the choice between a risky payoff (opening a randomly chosen box) or a safe pay-out. These questions are not just asked once, but in a dozen different variations with different probabilities and pay-outs. But the choice was always between a risky outcome and a certain outcome.
Another setup was the one shown below.
The complexity setup

Source: Oprea (2024)
Note that in this setup there is no risk. If the volunteer choses to open the 100 boxes with varying pay-outs she still gets a certain pay-out that is known in advance as if she just opens 100 boxes all with the same pay-out.
Except that people tend to be bad at maths and try to avoid solving complex maths problems in their head whenever possible.
What happens in practice then, is that if the maths behind the average pay-out with the boxes of varying pay-outs becomes too hard, people rather switch to the boxes with the constant pay-out, even if the resulting gain for them is lower. People try to avoid the mental work involved with complexity, even if there is no risk or uncertainty involved.
Here is a comparison of the choices the volunteers make when confronted with the lottery setup (grey dots) vs. the complexity setup (whit dots). They are always very similar.
Responses to complexity and lottery setup are very similar
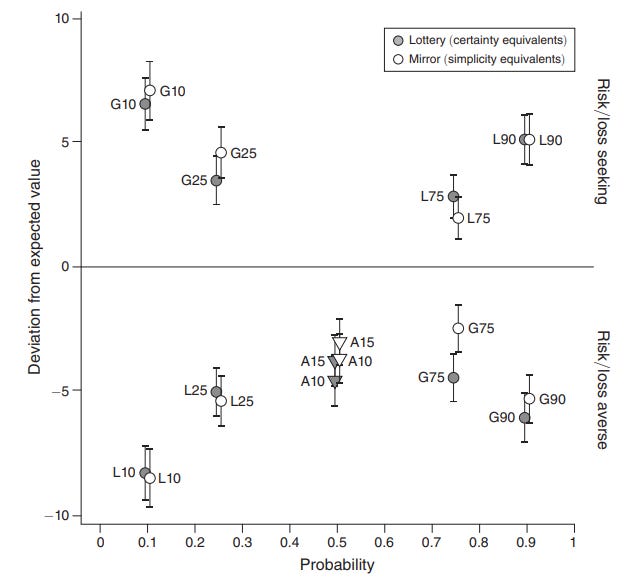
Source: Oprea (2024)
This raises significant questions about the way we measure risk tolerance in practice. If risk tolerance questionnaires use these kinds of lottery choices, do we really measure risk tolerance? Or do we rather measure the aversion of investors to complexity?
An old saying from early in my career on the difference between stock and bond investors was "the best day in an equity person's life is when they see a stock they own is up 10x. The best day in a bond person's life is when they get their principal back."
Here is an interesting post saying that Ryan made a mistake.
https://datacolada.org/124