I love it when I can debunk long-held finance dogma with a simple chart. One such dogma is that we need to have a balanced budget. If a government runs persistent deficits for a long time, investors will become reluctant to hold government debt and demand an increasing risk premium, which will create even bigger deficits and eventually triggers either a devaluation of the bonds or the creation of inflation through money printing or other measures to devalue the bonds in real terms. Alternatively, if a government runs persistently high deficits it will have to eventually raise taxes. Investors, knowing this will reduce investment and thus growth or demand higher wages in order to save for the day when the higher taxes come to pass. Either way, there is theoretically a link between a government running deficits for a long time and inflation following suit.
In the past, I have focused on the link between money printing and inflation and trashed the notion that an increase in the monetary base leads to higher inflation because at the time, some economists pushed that idea to claim that inflation will get out of control. Now that inflation seems to be topping out and their old money printing argument doesn’t work anymore, they are claiming that fiscal deficits will create inflation.
So let’s look at the evidence in favour or against a link between government deficits and inflation. To do this, let’s start with the United States, where this argument is promoted most often. In order to check the long-term connection between government deficits and inflation, I have done what I did in my previous post on the link between money printing and inflation: I look at rolling 10-year averages. After all, the claim is that persistently high and/or rising deficits should lead to inflation, not that any individual year’s deficit will lead to inflation. This was the argument behind all the fiscal austerity measures promoted in the UK, Germany and other countries after the financial crisis and is again the argument of austerity promoters today.
As you can see in the chart below, there is hardly any connection between deficits (deficits are plotted as positive numbers in the chart below) and inflation. The high inflation in the 1970s was not triggered by high government deficits and the high deficits of the 1980s in the United States did not lead to higher inflation but to persistently lower inflation. The last time we saw somewhat of a link between higher deficits and inflation was at the end of the Second World War when price controls (in place during the war) were lifted and inflation ran rampant. This inflation came about not because the government had run massive deficits in the years before but simply because prices were kept artificially low for years and caught up to real production costs.
US fiscal deficit and inflation (rolling 10-year averages)
Source: St. Louis Fed. Note: Deficits are indicated by positive numbers.
Now, you may say that the United States is just one case and a special case at that because it was the world’s leading economy and in charge of the world’s reserve currency, which means that everybody needs to buy US Treasuries, whether they like it or not. And that may have kept interest rates on Treasuries and inflation low over the last 70 years.
It’s a weird argument, but let’s run with it and look at the UK. Thanks to the good people at the Bank of England, we can check the relationship between government deficits and inflation in the UK back to 1689. Yes, for most of that period, the British Empire was the world’s leading economy and Sterling the world’s reserve currency, but at least since the end of the Second World War, the UK was just a country amongst many without special status.
The chart below shows that during wars, the deficit of the British Empire rose substantially and in many cases this increase in deficits was followed by higher inflation. The War of the Spanish Succession (1701-1714), the Napoleonic Wars of the early 19th century, and the First and Second World War are examples. But outside of these episodes it is impossible to find any connection between deficits and inflation in the UK.
UK fiscal deficit and inflation (rolling 10-year averages)
Source: Bank of England. Note: Deficits are indicated by positive numbers.
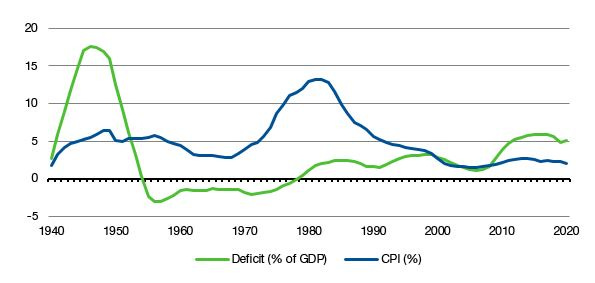
Zooming in on the time after the Second World War when the British Empire became history and the UK lost its status as the world’s leading economy, the picture looks even worse than in the United States. In fact, the correlation between deficits and inflation is slightly negative indicating that if deficits rose, inflation tended to drop. In my previous post on the missing link between money printing and inflation, I claimed that monetarists are trying to ride a horse that has been dead for decades. The people who are claiming that deficit spending leads to higher inflation are trying to ride a horse that has never really been alive to begin with.
UK fiscal deficit and inflation since 1940 (rolling 10-year averages)
Source: Bank of England. Note: Deficits are indicated by positive numbers.


I don’t know about others but I don’t overly depend on CPI. For me, my relevant rate of inflation to my reality is not some stats crafted by the government. If the exemptions from CPI data (food, petrol Etc) is where I spend my money on, that’s my “inflation”. There are many things tied to CPI such as COLA (cost of living adjustments) for other big items like Social Security checks so one might wonder if there is no incentive (conscious or otherwise) to keep certain public metrics low. Not saying that horse 🐴 is alive. Just saying I don’t even care
A neatly written article, making a point without excess waffle.
Should be required reading for any MP, or the equivalent around the world - there's even a chart or two for the hard-of-understanding.