

Diversification is not about low correlation but high dispersion

When investors talk about diversification the go-to variable to quote is correlation. Finding an asset with a low correlation to equities and bonds is part and parcel of the considerations of every asset allocator and CIO of an institution. Yet, correlation is not everything. What really matters for diversification is dispersion, not correlation.
One of the key concerns of my friends who advise American clients these days is that their clients are losing faith in international diversification. After more than a decade of outperformance of US stocks, US investors are wondering why they should even bother with European or emerging market stocks. European investors, on the other hand, are tempted to shift more and more of their equity allocation towards the US, since this seems to be the only market that performs well. So, when an advisor or consultant shows up and tells investors that international diversification is beneficial in the long run, they either quote Keynes or they comment that the correlation between US stocks and other developed market stocks is so high as to provide little diversification benefits.
As an example, let’s take a look at US and UK stocks since 1920. Over the last 100 years, the correlation between US and UK stocks was a whopping 0.7. Not perfectly aligned but a stat arb hedge fund would definitely consider these two asset classes as related closely enough to warrant an arbitrage position. Not much diversification benefit to get out of UK stocks if you are a US investor, is there?
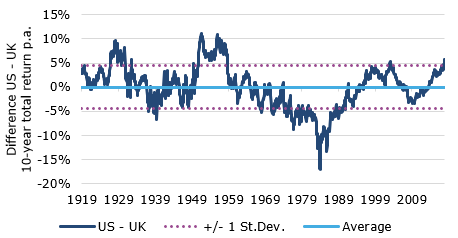
Our chart shows the difference in rolling ten-year total returns for US and UK stocks since 1920. Whenever the line is above zero, US stocks have outperformed UK stocks over the past ten years, and when it is below the zero line, UK stocks have outperformed US stocks. While in the long run, the average performance difference between the two markets is zero, ten-year return differentials can be extremely large. From June 1942 to June 1952 the US stock market outperformed the UK stock market by 11% per year. For ten years! That is a total outperformance of 185% after a decade. This outperformance of the US market was clearly driven by World War II and its destructive effect on Europe and the UK. But even if we ignore World War II, we can find ten-year periods where the US outperformed the UK significantly. The 5.6% outperformance of the US market in the last ten years is hardly exceptional as our chart shows.
On the other hand, there are plenty of periods, when the UK market outperformed the US by a wide margin. During the high inflation period of the 1970s from 1975 to 1985, the UK stock market outperformed the US by 17% per year (!) thanks to its tilt towards energy and mining companies. This range of outcomes is what we think of when we talk about dispersion. While the average performance difference between the two markets is zero the one standard deviation return difference between the two markets is 4.4% per year – or 54% after ten years. A focus on correlation rather than dispersion is short-sighted, because it ignores the material diversification benefits that can be achieved with assets that seem to move in line with each other even though the steepness of the trend might be very different, giving rise to significant performance differences.
Dispersion is also what gets forgotten by investors who claim that return forecasts that show big differences between US and non-US equities in the future are not plausible. Their typical argument is that the US is dominating global equity markets and if the US stock market has low returns, then European and emerging markets cannot have high returns. Our chart shows how erroneous this argument is and why we remain confident in the big return differentials we predict for the next ten years.
Finally, as we will show in the second part of this discussion, it is not correlation that matters for active fund managers but dispersion. But that discussion will have to wait until tomorrow.
10-year return differences between US and UK stocks
Source: Global Financial Data, Fidante Capital.