Last year, I wrote a note on the lack of diversification in retail investor portfolios. An analysis by VZ Vermögenszentrum in Switzerland showed that Swiss investors on average invest in a handful of active and passive funds but add on average six to seven stocks to the portfolio. The problem is that these six to seven stocks make up more than one third of the portfolio, thus creating significant concentration risk.
This concentration doesn’t have to be a problem. After all, many professional fund managers have highly concentrated portfolios as well. They deeply research individual companies and then invest in a select few where they have high conviction.
So, what are retail investors doing when they research the stocks that end up in their portfolio? Toomas Laaritz and Jeffrey Wurgler analysed anonymised web data for tens of thousands of US households in the first half of 2007 (ancient history, I know).
They found that retail investors visited the websites of finance news (by far the most popular was Yahoo Finance), brokers and banks on average 23 times each month. That sounds good. People who invest in stocks look like they are doing their homework.
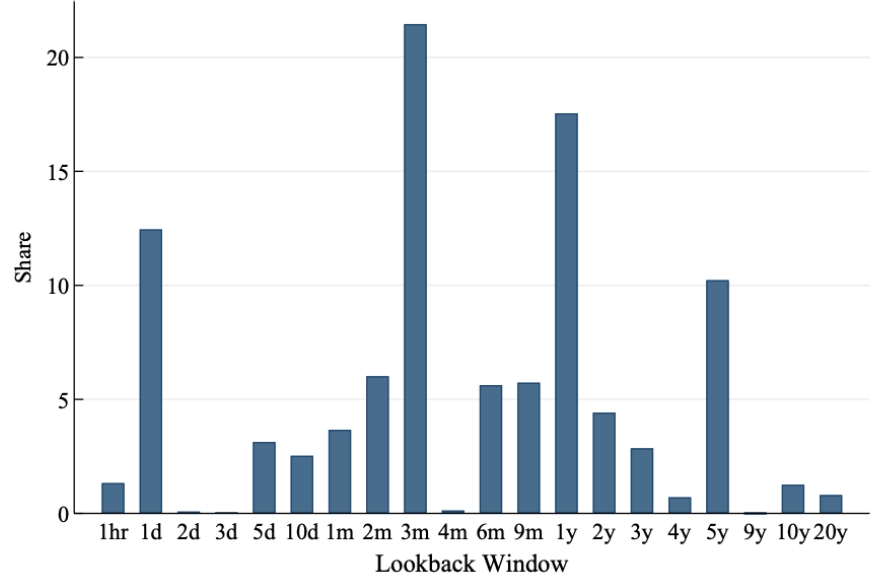
Not so fast. Below is a chart of the stock price charts they looked at. The researchers removed instances where investors just loaded up the stock chart and left it at the default time shown (which was typically one day or one month) and show only instances where investors changed the lookback period to their preferred history.
Length of chart look-back window
Source: Laaritz and Wurgler (2025)
What worries me about this is that the most common lookback period is three months. I don’t know what these people find in a three-month price chart (or a one-day or one-year price chart for that matter) that is informative for their investment portfolio. All these charts will tell you if the share price went up or down, so they only motivate investors to follow price momentum.
Nothing wrong with that, if the momentum is underpinned by solid fundamentals or investors systematically build a factor portfolio based on momentum. But in the former case, I would expect investors to spend a lot of time on other research besides looking at charts, while in the latter I would expect investors to buy many stocks to capture the systematic factor exposure. But with the average number of stocks in retail portfolios being so small, that does not seem to be the case.
Hence, the only way looking at these short-term price charts can make sense if investors are spending a lot of time on fundamental research to identify a few high conviction stocks and then use the charts to check for the most recent moves.
Which is where the second figure comes into play. The figure below shows the average time spent by retail investors researching a stock on the left and the median time on the right. Results are split between time spent before a purchase and time spent before a sale and show the cumulative time spent researching a stock from 192 hours (8 days) before the trade was made to 48 hours (2 days) after the trade. Note that this data includes the time investors spend looking up share price charts.
Average research time (left) and median research time (right) of retail investors
Source: Laaritz and Wurgler (2025)
In case you didn’t notice, the scale on the vertical axis is minutes. On average, retail investors spend about 7 minutes of research time before they buy a stock and a little over ten minutes before they decide to sell a stock. They add a little bit of time looking at the stock after the transaction but that is likely just to check how things are going once they have pulled the trigger. Thus, the average time spent researching a stock before a transaction is some 20 minutes, most of which happens shortly before the investors buy or sell the stock.
20 minutes of ‘research’ and no time to reflect on the information. Just fire and forget.
But 20 minutes is only half the truth because that number is heavily skewed by the small number of retail investors that spend a lot of time looking at a stock before they buy or sell it.
The median research time is a better metric in this case because 50% of investors will spend more time and 50% less time than that before buying or selling a stock. And the median time spent ‘researching’ stocks before pulling the trigger is less than four minutes. About as long as it took you to read this note.


ah, so the difference between the masses and voodoo chartists will be ~4 more minutes within the flattish median !
I define as a retail investor (1), and I feel offended! 😉
Isn’t this paper just a performative act of finger-pointing? I’d argue that focussing on time spent by retail investors misses the point.
Firstly, by definition they don’t invest for a living, so available time is severely limited. Twenty-odd stocks might be considered ‘reasonably diversified’. If, as an example, one spent a whole Sunday afternoon properly analysing each stock – would one’s family agree that this is the best use of one’s time? (One would also need a sell trigger other than ’when I’m down 70%’.)
Then, just staring at the stock chart for longer also wouldn’t help awfully.
Rather, what retail investors seem to be lacking is financial literacy. What should be addressed is problem awareness and easy access to easy-to-understand educational resources.
———
(1) Maybe I’m more of a ‘prosumer’. I run a 20-stock formula-based value portfolio. Methodology is stolen from Greenblatt’s Magic Formula, five cheapness factors are from GMO and Meb Faber. Takes me about a day each quarter to manage. Up 180% vs. 130% for the DAX since inception (2016). ‘Not to brag but to inspire’, as they say on social media.