

Apparently, Europe is so poor that if it were a US state, it would be the poorest or second poorest state by GDP per capita. If you measure it in current US dollars, the GDP per capita of the Eurozone at the end of 2024 was $46,724 vs. $85,809 for the US overall, $41,603 for the poorest US state (Mississippi) and $47,262 for the second poorest (West Virginia). Are we really that poor in Europe?
First, and most importantly, GDP per capita is often touted as a measure of living standards, but that is utter nonsense. GDP per capita does not measure quality of life, and claiming that Europe is as poor as Mississippi or West Virginia is just nonsense, as this video explains in wonderful detail.
By the way, the nonsense of conflating GDP per capita with living standards goes both ways. Luxembourg has the highest GDP per capita in the IMF database, but if you have ever visited Luxembourg, you will know that it is so boring that one cannot call what the inhabitants do there 'living'.
But even if you want to compare GDP per capita across countries as a rough proxy for economic output per person, then you are faced with statistical quirks that most people never pay much attention to.
The numbers I have quoted at the top are GDP per capita in current US dollars calculated across countries using current exchange rates. Well, after 10 years, when the trade-weighted US dollar strengthened by 22% many would argue that the dollar is quite expensive right now. So, comparing the US GDP per capita with that of other countries benefits the US.
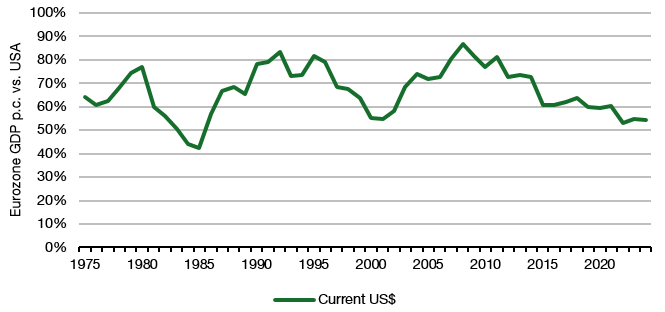
The chart below shows the Eurozone’s GDP per capita relative to the US GDP per capita in current exchange rates. A number above 100% indicates that Eurozone GDP per capita is higher than that of the US. At the end of 2024, the Eurozone’s GDP per capita was just 54.5% of US GDP per capita, but in 2008, when the Euro was strong, it was 86% of US levels. But I seriously doubt that the Eurozone has become 30% poorer over the last 17 years or the US 30% richer. In stock market terms, maybe, but certainly not in economic output, let alone in ‘living standards’.
Eurozone GDP per capita vs. the US in current exchange rates
Source: Panmure Liberum, World Bank
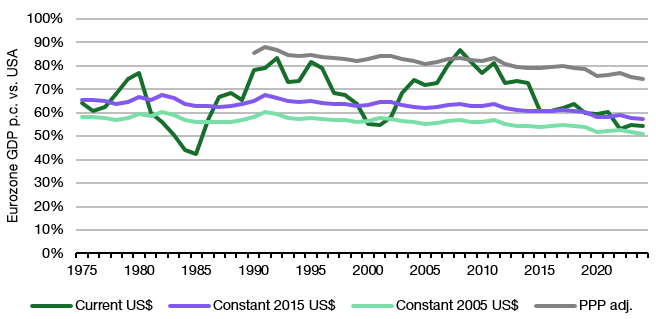
The common remedy against these exchange rate fluctuations is to express GDP per capita in constant US dollars, i.e. choosing a fixed exchange rate for the entire time series. But this again leaves us open to an arbitrary choice of exchange rate. The World Bank expresses GDP per capita in 2015 exchange rates, but if I use 2005 exchange rates instead, I can artificially inflate the Eurozone’s GDP per capita by about 6%. And if I chose another date for my exchange rate, I could shrink Europe’s economy by a couple of percentage points as well.
The most accurate number typically is GDP per capita adjusted for purchasing power parity (PPP), which, as you can see in the chart below, is much higher in the Eurozone because we didn’t have as much inflation as the US did over the last decades, meaning our money stretches further when buying goods and services. There is an awful lot of statistical lying that can go into calculating PPP as well, but for the purpose of this post, let’s just say that PPP-adjusted GDP comparisons are my preferred measure. And according to that measure, the Eurozone’s GDP per capita is 75% of the US.
Eurozone GDP per capita vs. the US with different methodologies
Source: Panmure Liberum, World Bank
The bottom line is that when it comes to international comparisons of GDP and GDP per capita (and indeed all macro data), you can choose your translation statistic in such a way to spin every story you want to tell. Want to tell that Europe is poor and in decline, choose GDP in the current currency. Want to tell a story of smaller relative gaps, choose GDP adjusted for PPP.
As I said, in general, I prefer to use GDP adjusted for PPP because that is the measure that matters in practice. In daily life, people and businesses don’t care how much their income is worth in US dollars or Euros, but how much they can buy with the money. And that means expressing it in local purchasing power is the relevant measure.
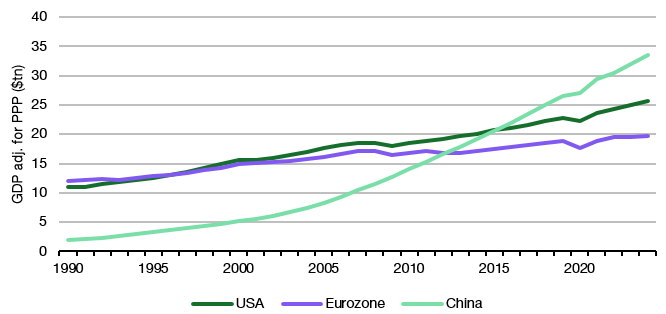
But PPP is a concept that needs to be explained to the general public, and that means in today’s world, in the media, you will almost never see a discussion based on PPP-adjusted data, but typically on current exchange rates. And that is highly misleading. Especially when you think about which country is the largest economy in the world, just take a look at the chart below with PPP-adjusted GDP.
Which is the largest economy in the world?
Source: Panmure Liberum, World Bank
The last graph is also open to debate, not only because China has more than four times the population of the US and the eurozone, but also because the Chinese welfare system is currently unable to cope with the impact of its demographic pyramid, which resembles a kebab.
China also lacks the ability to attract human capital, an ability that Europe continues to have.
I am not saying that Europe will emerge at the expense of China or the US, but that we are currently in a century without a clear winner, despite the proclamations of the various factions.
I would only say that Russia is destined to collapse, even if the timing is unclear.
Excellent compilation of data, for a really important topic!
I know several Americans who gladly live in Germany, mainly because they live a less precarious and stressful life here, but also because most things are a hella lot cheaper. Buying something like a new Dacia car for €14k? Renting a reasonable-sized apartment in a demographically acceptable neighborhood of a large city for €900? Impossible, they say.
Of course, they are firmly in the middle-class cohort, which in the U.S. can mean a car wash manager making $110k, but on the other hand, can also be a double-income family that can't really make ends meet. If they were higher up in the corporate ladder, living in the U.S. would make a lot more sense.