


Good news: Skew, for lack of a better word, is good

Everybody knows that returns are not symmetrically distributed around a long-term average. Instead, they are skewed with either higher than average returns more common than expected or lower than average returns more common than expected. And this skewness creates significant return opportunities.
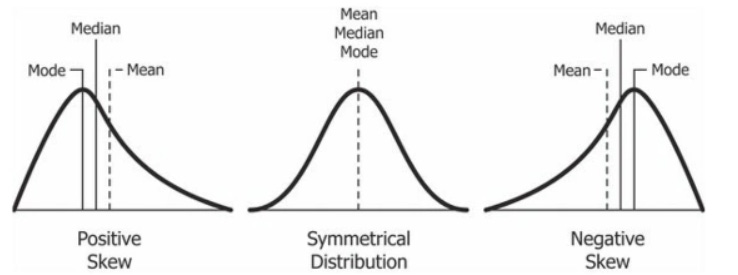
First, an introduction to skewness in returns. The chart below shows an unskewed (theoretical) return distribution for a stock together with a negatively and a positively skewed distribution.
Theoretical return distributions with different skews
Source: The internet
Positively skewed distributions are like lottery tickets. Stocks that have this kind of distribution are often called lottery stocks. Most of the time, they will create a low or even negative return but there is the possibility of a rare but large return.
Negatively skewed distributions are the opposite. Most of the time they will deliver a small but positive return but occasionally they will collapse, and investors suffer a big loss. This is the kind of distribution that most hedge funds have because they are constantly looking for opportunities to make a moderate amount of money with little risk, though sometimes they may suffer outsized losses.
Many retail investors prefer lottery stocks, which contributes to them underperforming markets in the long run. The reason for this underperformance of lottery stocks is that extreme drawdowns tend to be rare while small losses are common. Negatively skewed stocks on the other hand have rare but large drawdowns which forms a significant risk to investors and makes them harder to own from a psychological perspective. It is emotionally much easier to digest recurring small losses than one catastrophic loss.
This psychological difficulty in owning stocks with negative skew implies that investors should demand a ‘risk premium’ as compensation. And ever since the ground-breaking study by Campbell Harvey and Akhtar Siddique in 2000, we know that there is indeed a systematic risk premium in stocks with lower skew vs. stocks with higher skew.
Paul Karehnke from ESCP Business School in France repeated the study but looked at how this skewness premium changes over time. He found that except for the 1963 to 1993 period, the skewness premium was quite a bit higher than the 3.6% average outperformance per year reported in the original study. In the 21st century stocks with low skew outperformed stocks with high skew by a whopping 7.8% per year.
Skew premium per year

Source: Karehnke (2024)
Indeed, the skewness premium is more dynamic than that and depends heavily on the skewness preference of investors which changes all the time and unfortunately cannot be measured directly but must be inferred by fitting a model. The chart below shows the estimate for investor skewness preference over time. As you can see, while there are occasional large swings during financial crises and recessions skewness preference has been consistent and high in normal markets. And that means that as long as we stay away from another crisis, the skewness premium should remain large and provide investors with a powerful tool to find stocks that outperform in the long run.
Skewness preference over time

Source: Karehnke (2024)
Thanks for a great article, adding a little science to the black art of investing.