How flows change factor performance
Every investor knows that the performance of factors like value or momentum declines if more investors put money at work in these factors. This is one of the key reasons why factor performance waxes and wanes over time. But thanks to a brilliant study by Nikolay Doskov, Thorsten Hens, and Klaus Reiner Schenk-Hoppé we can put some numbers to this effect. The paper is an absolute must read for every fund manager, so let’s look at some highlights.
What the old man and his colleagues (sorry, Thorsten is an acquaintance of mine and the guy who taught me behavioural finance at university) did was deceptively simple. They looked at all the stocks traded on the 14 largest stock exchanges in the world and formed portfolios based on the different factors as well as passive portfolios that just replicate the market. They considered both long-short and long only factor portfolios, but I will only deal with long only portfolios here.
Then, in each month from 1995 to the end of 2020, they track the performance of each stock and check which stocks move in and out of the different factor portfolios. This way, they can simulate how investor flows change different factor portfolios over time and how in the medium- to long-term these flows change the returns of different factors.
Here is what they estimate happens to the returns of the four main factors (value, small cap or size, momentum, and quality) if 1% of the total market is shifted into these factor portfolios. Note that the total market cap of the stocks in their study is about $60 trillion, so 1% corresponds to net inflows from passive strategies to these factors of c.$600bn worldwide.
Impact of 1% of market cap inflow into factors
Source: Doskov et al. (2024)
As you can see the returns of the value factor are reduced by only 2% p.a. while momentum returns decline by about 8.6%. If investors chase the best performers of the past, they quickly reduce the returns of momentum strategies because they push the prices of expensive stocks even higher. Meanwhile, if investors move into cheap value stocks, they reduce the potential future return by much less because these stocks remain cheap – and thus poised for future outperformance – even after the inflows.
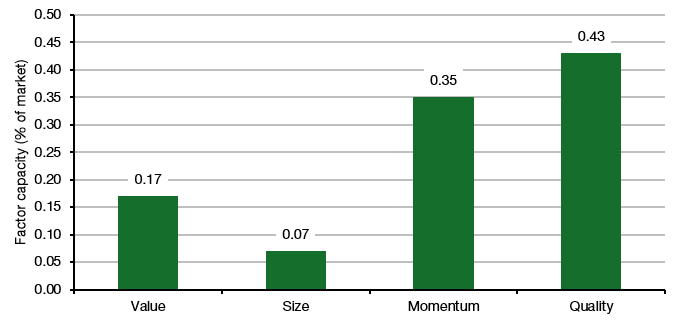
Intuitively, one could interpret this as value and small cap portfolios having higher capacity (i.e. they can digest more inflows before their outperformance disappears). But this is not true because different factors have different long-term performance. If we turn the calculation around and ask what percentage of the total market needs to move into the factor portfolios before the outperformance disappears, we get the chart below.
Capacity of different factors
Source: Doskov et al. (2024)
Because the average outperformance of value strategies vs, the market is much smaller than the average outperformance of momentum portfolios. In the end, value and small cap strategies have the least capacity and their outperformance tends to disappear if a mere 0.17% of the total market cap (c.$102bn) and 0.07% of market cap (c.$42bn) flow into these factors globally.
For individual markets, the capacity is correspondingly smaller. If I assume for the moment that the same capacity applies to UK and US stocks only, then the value factor has a capacity of c.4bn in the UK and c.95bn in the US. The size factor, meanwhile, has a capacity of less than $2bn in the UK and c$40bn in the US.
What I find particularly interesting, though, is that the study also estimates cross-factor impacts. If more money flows into momentum stocks, the expensive stocks tend to get more expensive while the cheap stocks tend to get cheaper. This should increase the return potential for value investors. Indeed, the chart below shows that if 1% of the total market flows into momentum portfolios, then the return outlook of the value factor increases but 0.6% per year. Similarly, the return outlook for small cap investors increases as well, while quality factor portfolios see their return prospects diminished because quality factor portfolios have large overlaps with momentum factor portfolios.
Impact of 1% inflows in momentum stocks on the return outlook of other factors
Source: Doskov et al. (2024)
You can look up all the other cross-factor impacts in the note, but what this note does is enable us investors to track investor flows and get a rough estimate of how that changes the return outlook for factor portfolios over time.


Brilliant research and report. And can we now design an ETF which will respond to cash flows in line with the findings of this work? I for one, pledge my support.:)
"If more money flows into momentum stocks, the expensive stocks tend to get more expensive while the cheap stocks tend to get cheaper. This should increase the return potential for value investors."
The parent company for the firm for which I used to work also owned the world's biggest bond fund manager, and when they had one of their "value" strategies serially underperform for years on the trot, they would call it "stored performance", which I found a brilliant way of turning a proverbial sow's ear into a silk purse.
Applying this logic to real estate, we should all be buying homes in bad neighborhoods instead of continuing to bid up houses in urban centers and ritzy suburbs. But perhaps expensive stocks are more akin to beachfont properties; constrained supply makes them expensive, but when a big storm hits, the damage is usually so "too big to fail" catastrophic that the government (and taxpayers) end up footing the bill.