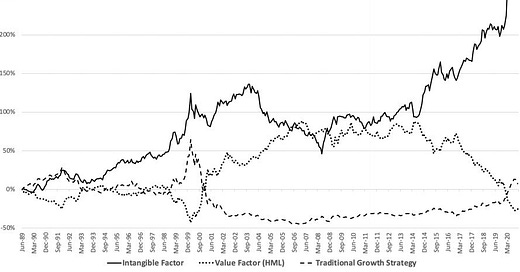
Amongst professional value investors – or at least the ones that have survived to this day – it is by now well-known that traditional value measures like price/book-ratios have become less informative for future performance. I have written here that this may be to a large part due to the rise of intangible assets on the balance sheets of so many companies. Stripping the balance sheets of companies from these intangible assets helps improve the value factor.
The main problem with intangible assets is that hardly anyone really knows how to value them. And I presume that gave Dion Bongaerts, Xiaowei Kang, and Mathijs A. van Dijk from the Erasmus University in Rotterdam an idea. If these intangible assets are so difficult to value, then they may give rise to systematic mispricing driven by always changing perceptions of these intangibles. Companies with lots of intangibles on their balance sheet should have stronger growth since these intangibles often arise from R&D investments and acquisitions of other companies. If investors systematically underestimate the long-term growth potential driven by these investments and acquisitions then companies with a larger share of intangibles should have higher returns than companies with a lower share of intangibles. In other words, measuring the amount of intangibles relative to tangible or total assets would be a measure of growth. Of course, if investors systematically overestimate the future growth created by these intangible assets the reverse would be true and a higher share of intangibles would be an indirect measure of value.
Examining the stocks in the Russell 3000 excluding financials from 1989 to 2019 shows that intangibles as a share of total assets has much larger predictive power than one would expect. A portfolio that invests in the 20% stocks with the highest intangible asset ratio and shorts the 20% companies with the lowest intangible asset ratio created an average annual performance of 4.6%. Over the same period, using the same stocks, the value premium was -0.3% per year and the quality (profitability) premium was 3.5%. In other words, the intangible factor was better at explaining stock returns than value or quality. As usual, the returns were higher for small cap stocks than large cap stocks, but even in large caps, it was 3.2% per year.
Looking at the relationship between the performance of value strategies and intangible asset strategies, the research showed a negative correlation of -0.58. Thus, investors seem to systematically underestimate the profit growth generated by intangible assets. This also opens up the possibility to combine the value factor with the intangible asset factor in order to stabilise the performance of traditional value strategies. A pure value strategy relying on price/book-ratios alone would have had a return of -0.3% per year and a volatility of 11.5%. Mixing this long-short portfolio with the long-short portfolio generated by the intangible asset ratio 50/50 created a portfolio with an average annual return of 2.1% and a volatility of 4.8%.
As usual, there is much research that still needs to be done. We need to examine if the intangible asset ratio also works outside the United States, how much returns are reduced by transaction costs and if there are smarter ways to combine this factor with the traditional value factor, etc. It’s early days, but if I’d be running a value portfolio I’d be looking at this more closely.
Performance of value, growth, and the intangible asset factors
Source: Bongaerts et al. (2021)


Ah - really cool. I do wonder what the correlation of an intangible asset portfolio is to that of a tech heavy portfolio. Confounding variables at play here...