It is May, the days are getting warmer, and I notice more and more women around me wearing short skirts. But this year, it seems that skirts are really short, which has caught my attention, as I am sure it did for every middle-aged man well past his prime, like me. This reminded me of the famous hemline indicator that postulates a correlation between economic conditions and the length of women’s skirts. So, in the name of science and the pursuit of truth, I went on a mission to investigate the truth behind the hemline indicator.
The first step in any scientific endeavour is the development of a testable hypothesis. When it comes to the relationship between economic conditions and skirt length, this is already quite hard. One hypothesis is that skirts get shorter in good economic times as they did in the 1920s and 1960s. But other people have claimed that hemlines get shorter when the economy weakens. So, I concluded to test the two opposing hypotheses simultaneously.
The second step is to collect empirical data based on a rigorous scientific protocol. In my case that meant sitting in the beer garden of my local and watching all the women pass by evaluating the length of their skirts. After a long day of hard observational work and meticulous data collection, I decided the data was still ambiguous and I needed several days of additional data collection. Unfortunately, my wife intervened and told me that there are peer-reviewed journals with a high impact factor that have already published sufficient data for my analysis. She gave me a copy of Vogue magazine from February and forced me to read through it.
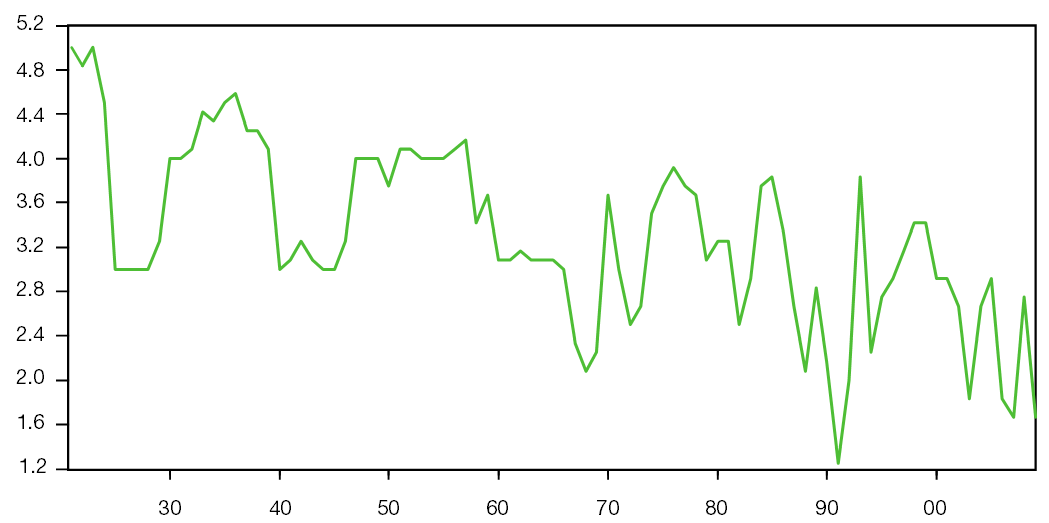
That was when I decided that data collection wasn’t really all that important for my project and I should rather find a time series of skirt length that I could regress on actual economic conditions. Luckily, Marjolein van Baardweijk and Philip Hans Franses had collected that data based on their analysis of fashion magazines going back to the 1920s. They classified the hemline as one of five lengths, ranging from 1 (mini skirt) to 5 (floor length). The chart below shows the average hemline index on a rolling 12-month basis.
Hemline index on a rolling 12-month basis
Source: van Baardweijk and Franses (2010)
There clearly is a long-term trend toward shorter skirts but there are also pronounced cyclical swings.
Using a linear regression model with US recession data the two economists tested the lead or lag between recessions and changes in the hemline index. Using standard econometric methods, they concluded that the best fit could be achieved if one assumes the hemline reacts to economic conditions with a three-year lag. They also found that shorter skirts indicate better economic times in the past. Hence, this year’s short skirts are a reflection of the economic boom of 2019.
But more importantly, 2019 was followed by the deepest recession in 80 years in 2020. So expect the hemline of skirts next year to go way down creating a jump in the hemline index to between 4 and 5 as in the Great Depression of the 1930s, or towards full-length skirts.
But why is there such a long lag between economic conditions and skirt length? Nobody knows. Econometric methodologies discover correlations all the time, even if there is no causation. But to test causation, we need more data. So, I will continue to measure hemlines diligently every year as the weather gets warmer. It’s a tough job, but in the name of science, somebody’s got to do it.


lol
Haha, great article! I wonder what the resurgence of 90s mom-jeans and 80s haircuts will mean for stock markets going forward 🙂