Is there a green bubble forming?
As my readers know, I am a fan and proponent of ESG investing. I think this is not just a fad and instead will only become more widely accepted as time goes by. On the other hand, I have friends (mostly in the US) that are highly sceptical of ESG investing and consider it a fad or something that actively destroys returns. And I like to discuss the issue with them because it prevents me from falling into the trap of not questioning the developments in the space. And there is a lot to be critical about when it comes to ESG investing.
One topic that remains hard to measure is whether the ESG investing trend creates a bubble in green stocks vs. brown stocks. If ESG analysis covers risks that are not priced in financial markets, then green companies with lower ESG risks (or higher ESG scores) should have a return advantage over brown stocks with higher ESG risks (or lower ESG scores). However, as ESG investing becomes more widely adopted, brown stocks should decline relative to green stocks until they have higher expected returns that compensate for the higher risks of these stocks. Hence, one would expect that in the beginning green stocks outperform brown stocks creating a green bubble, but once a new equilibrium has been found where ESG risks are integrated into the analysis of most investors, brown stocks should have higher returns.
The most direct empirical evidence that this process is in full swing comes from recent research presented by Maximilian Görgen and his colleagues at the first conference on the economics of climate change held by the San Francisco Fed in November 2019. At that conference, Görgen and his colleagues presented some initial results from the Carima project that tries to measure the exposure to carbon risks of more than 10,000 listed companies around the world. They took 55 indicators of companies’ exposure to climate change in their value change, their public perception and their adaptability to climate change and calculated a so-called BGS score. This score is designed so that higher values indicate a bigger exposure to climate change and bigger downside risks to the stock if the planet starts to price carbon and introduces other important measures to curb climate change. This BGS score also allowed the researchers to calculate a carbon beta and a brown-minus-green (BMG) factor.
The chart below shows the average carbon beta of different stock markets around the world, where a higher beta implies that the stock market will be more adversely affected if climate risks get priced by investors or if climate policies become stricter. We can see that European stock markets are far less exposed to climate risks than the United States and Canada, and most emerging markets.
Average carbon beta of global stock markets

Source: Görgen et al. (2019). Note: A higher beta is indicated by brown shades and implies higher risks for stocks in times of climate change.
The differences in carbon beta between countries are mostly driven by the sector composition of these markets. The chart below shows the carbon betas of companies in different sectors with the green and brown bars indicating the range between the top and bottom quartile of stocks in the sector. To nobody’s surprise, energy and mining companies have the most to lose from political action fighting climate change. To nobody’s surprise, these are also the companies that lobby most aggressively against actions such as carbon pricing. On the other hand, the sectors that are least exposed to climate change risks are technology and industrials simply because their activities tend to produce much less CO2 than the activities of companies in other sectors. But within both of these sectors, there are clear differences between companies. For example, a chipmaker or a company producing capital goods will have much higher CO2 emissions and a higher carbon beta than a software company or a human resources company.
Average carbon beta of stock sectors

Source: Görgen et al. (2019). Note: A higher beta implies higher risks for stocks in times of climate change.
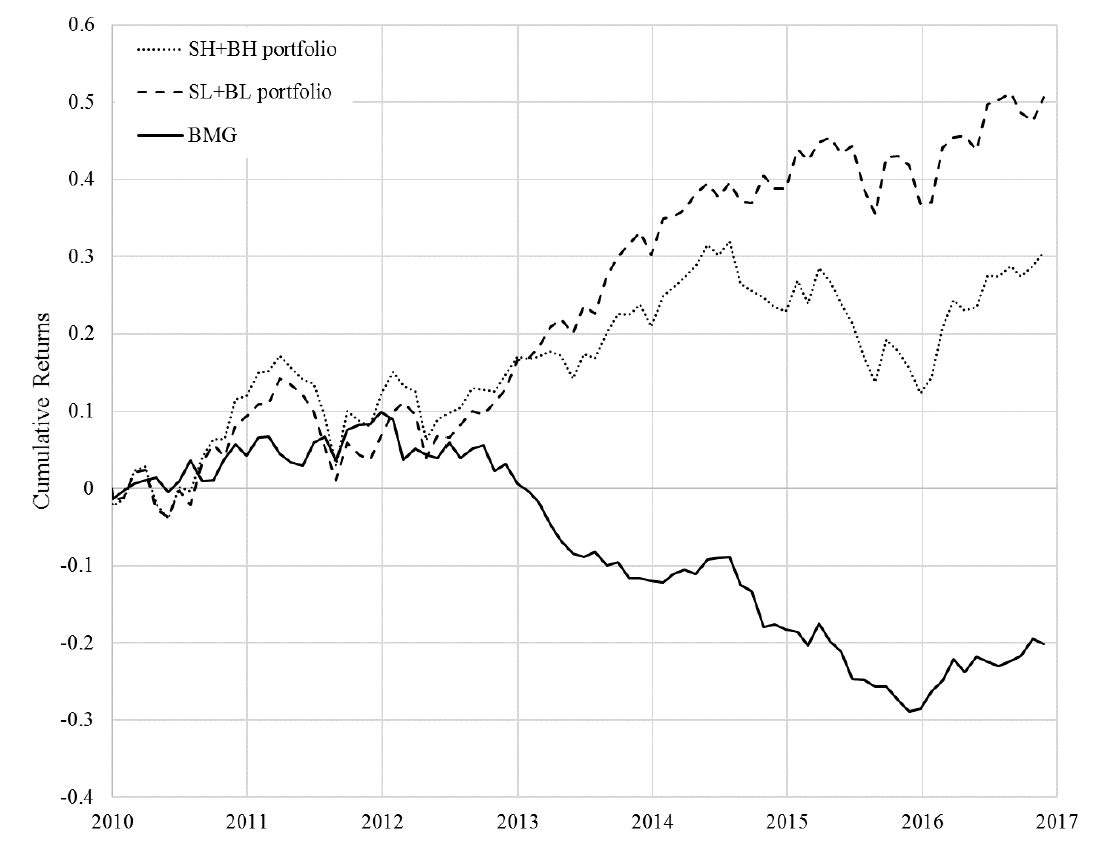
The most interesting result is that these climate risks are increasingly priced in markets, giving rise to the developments I have sketched out at the beginning of this post. Görgen and his colleagues sorted the stocks based on their carbon beta and formed portfolios based on the BMG factor. Brown stocks with higher carbon beta had a decent performance over the last decade, but since about 2013, green stocks with a low or negative carbon beta had done even better. In fact, the BMG-factor that goes long brown stocks and short green stocks has seen a significant negative performance over the last five years or so, indicating that the shift towards green stocks is in full swing. Putting the BMG-factor into a Fama/French three-factor model shows that the BMG-factor creates about the same contribution to portfolio volatility as the size factor, so it should not be neglected.
Of course, what we witness in the chart below may simply be the initial stages of a green stock bubble forming that will eventually burst. So far, however, it is impossible to tell, if the developments we observe today are already a bubble or just the expected shifts in markets as investors become more aware of ESG risks.
The performance of brown vs. green stocks

Source: Görgen et al. (2019).


