Climate change is changing our weather. And of course, global warming doesn’t simply mean it is getting warmer. Instead, we are seeing more extreme weather phenomena even in moderate climates such as the UK. We are now able to predict weather changes on a relatively granular level as Chris Brierley and Hannah Woodward have done for every electoral constituency in the UK.
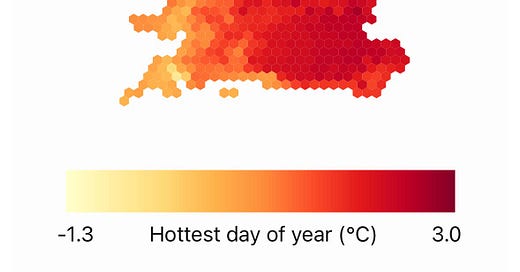
Since the 1960s, we have seen the hottest day of the year become about 2C to 3C warmer on average.
Change in temperature of the hottest day since the 1960s
Source: Brierley and Woodward (2024)
This isn’t dramatic, but these are multi-year averages. In any given year, the swings are much larger so that we are breaking temperature records and have longer and more extreme heatwaves in the UK today. 40C was unimaginable in the UK a couple of decades ago. Now we had the first few days with these temperatures and in the future, these days will become more frequent still.
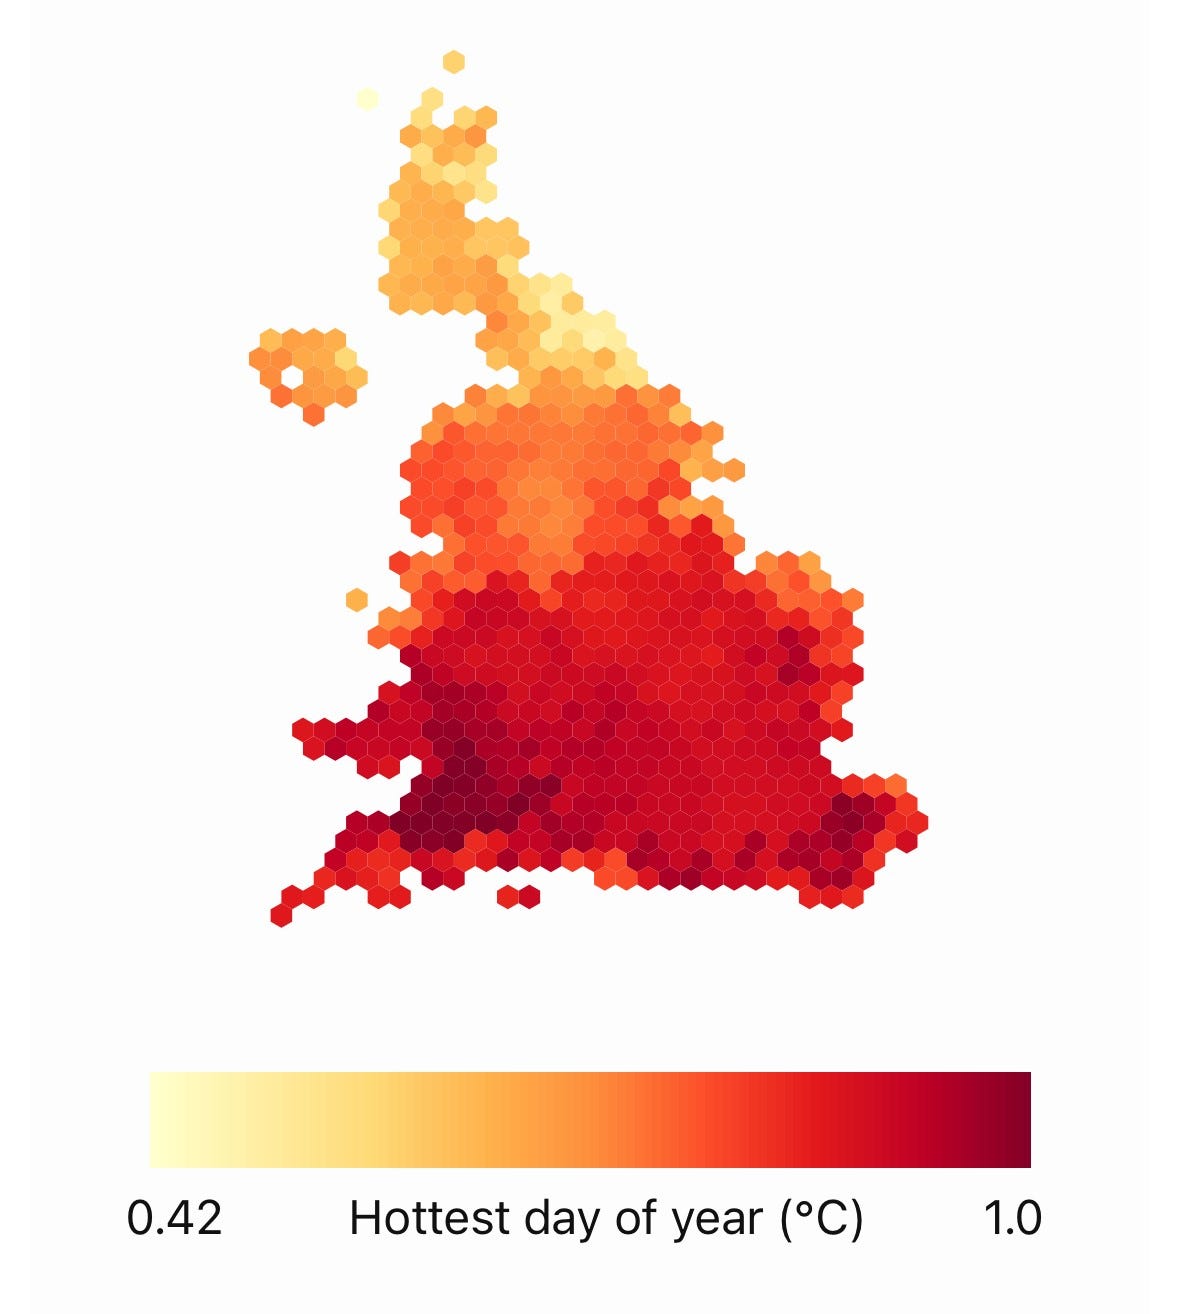
Indeed, here are the projections for the change in temperature of the hottest day in the year between today and 2040. Cities like London are expected to see another 1C increase in average temperature. And in the city of London itself, this 1C increase in the temperature of the hottest day will probably be even worse because of the urban heat island effect. So prepare yourself for some truly awful summer days if you live in London.
Projected change in temperature of the hottest day from 2021 to 2040
Source: Brierley and Woodward (2024)
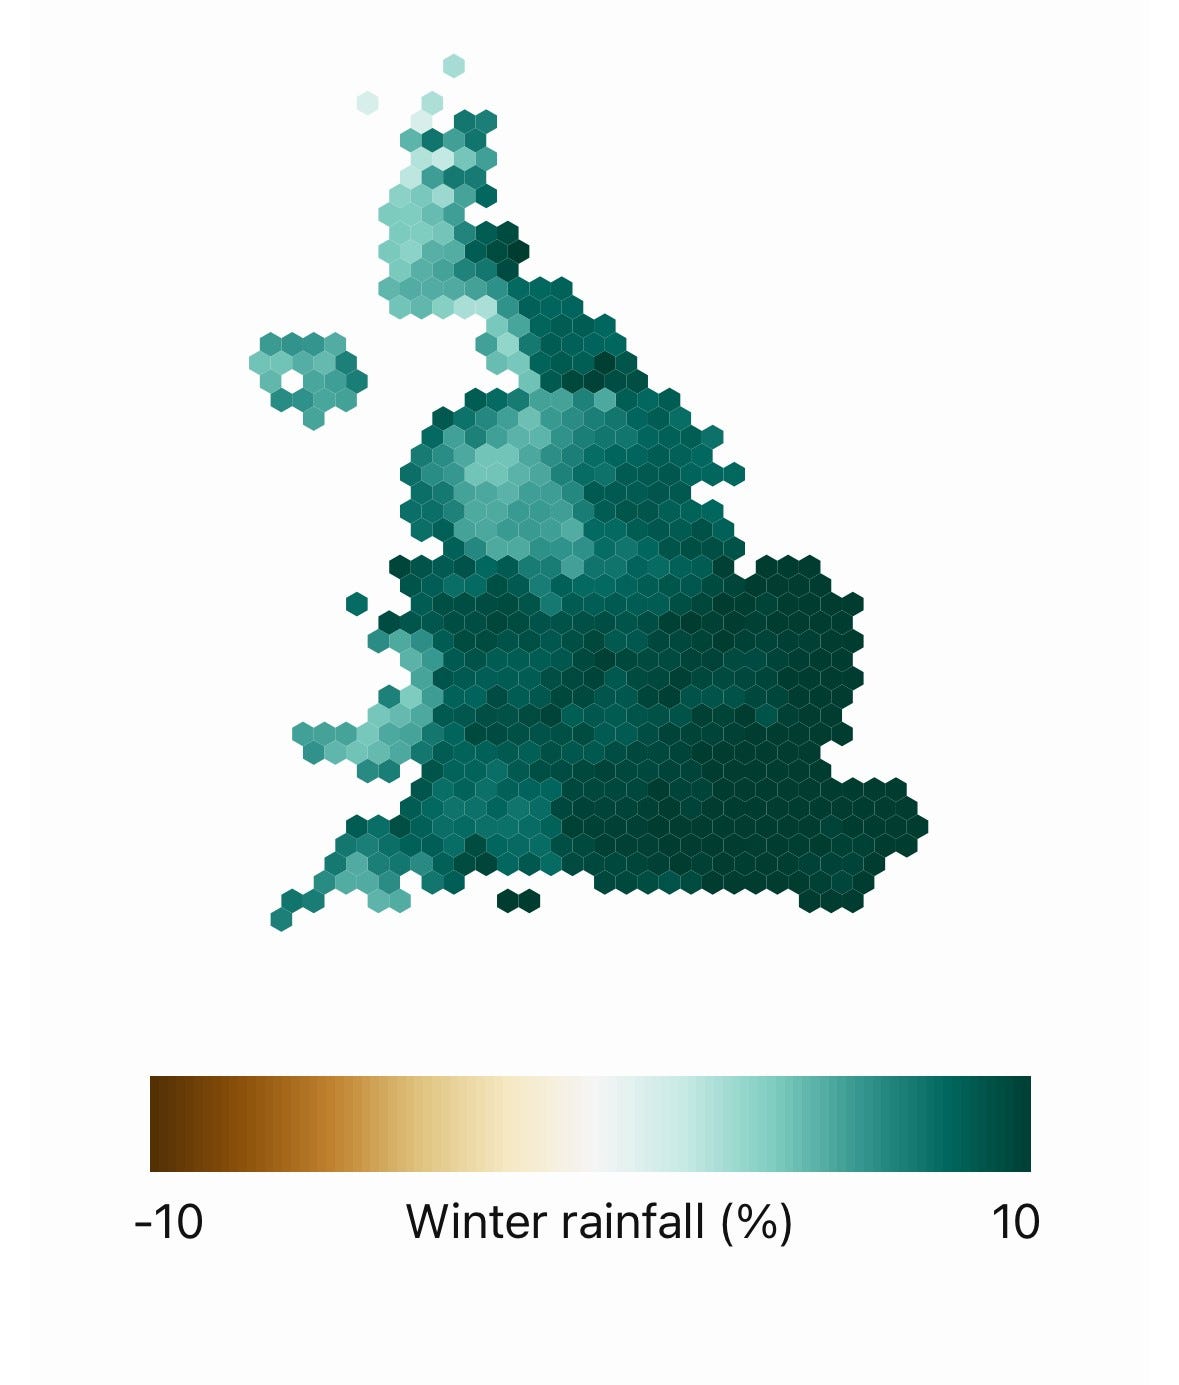
But there is something even worse than a couple of super-hot days in a city where no house has air conditioning and where houses are designed to keep heat trapped inside rather than cool the rooms. And that is spending winter in a cold, and wet country like the UK. The projections for winter rainfall in the UK look truly terrifying to me. On average, rainfall in London is expected to increase by 10% in winter. As if winters weren’t cold and wet enough already…
Projected change in winter rainfall from 2021 to 2040
Source: Brierley and Woodward (2024)
First, i 'm sure the (other) careful reader(s) was/were as disappointed yet not surprised by this below as i was (but hey, it's the decolonizing, planet-saving, critically capitalist sjw's of The Conversation- a not that regularly quoted source in this Substack ;-)
Apparently The Conversation assumes that the Conversation reader is, when climate is concerned, to quote Tim Waltz, 'weird'. (For some that indeed may be an accurate assumption). But one must be quite a, let’s say intellectually generous person, to not be insulted by this paragraph:
‘We then ran these programs focused on each UK constituency and looked at how the projected climate averaged between 2021 and 2040 would compare to the actual weather averaged over 1981-2010 (𝐢𝐭’𝐬 𝐦𝐨𝐫𝐞 𝐮𝐬𝐞𝐟𝐮𝐥 𝐭𝐨 𝐜𝐨𝐦𝐩𝐚𝐫𝐞 𝐭𝐡𝐞𝐬𝐞 𝐥𝐨𝐧𝐠𝐞𝐫-𝐭𝐞𝐫𝐦 𝐚𝐯𝐞𝐫𝐚𝐠𝐞𝐬, 𝐬𝐢𝐧𝐜𝐞 𝐭𝐡𝐞 𝐰𝐞𝐚𝐭𝐡𝐞𝐫 𝐟𝐥𝐮𝐜𝐭𝐮𝐚𝐭𝐞𝐬 𝐚 𝐥𝐨𝐭 𝐟𝐫𝐨𝐦 𝐲𝐞𝐚𝐫 𝐭𝐨 𝐲𝐞𝐚𝐫)’
It fluctuates. You don't say...
Unless you still watch Teletubbies (or have progressed on the downward trajectory so far that you're watching it again) this information is not ‘𝐦𝐨𝐫𝐞 𝐮𝐬𝐞𝐟𝐮𝐥’. It hurts your brains. The actual scientific definitions of climate and weather are simply that ‘climate’ is 30 years + and ‘weather’ is anything below that. And note how their 2021 - 2040 projection is NOT climate as per the official definition. Why did they not apply the official 30 year period?
Second, if you read the summary https://tinyurl.com/2s4j98dr by World Weather Attribution of its study from the The Conversation link you see a typical hierarchy where they list their key findings: the human drama ends up on top and facts come only after that (and remember that the IPCC has NOT detected / attributed flooding - link at the bottom):
'deaths, flooding, transport disruptions and power outages, among other impacts, to the UK and Ireland.
Successive floods have compounded impacts on the agriculture and housing sectors, leading to cascading impacts on socioeconomic and psychosocial health, and eroding people’s coping capacity, particularly low-income groups. Combined with the cost-of-living crisis, the successive flood events are another layer of disruption at a time when people’s financial resilience is already being tested'
Oh dear.
It then continues with at the bottom of its list this:
'Looking at average SSI (Storm Severity Index) on storm days, while some studies using other methods suggest an increase in storminess in a future climate, 𝐨𝐮𝐫 𝐚𝐧𝐚𝐥𝐲𝐬𝐢𝐬 𝐡𝐚𝐬 𝐬𝐡𝐨𝐰𝐧 𝐚 𝐝𝐞𝐜𝐫𝐞𝐚𝐬𝐢𝐧𝐠 𝐭𝐫𝐞𝐧𝐝. 𝐎𝐮𝐫 𝐫𝐞𝐬𝐮𝐥𝐭𝐬 𝐬𝐡𝐨𝐰 𝐭𝐡𝐚𝐭 𝐚𝐯𝐞𝐫𝐚𝐠𝐞 𝐒𝐒𝐈 𝐢𝐧𝐝𝐢𝐜𝐞𝐬 𝐚𝐬 𝐨𝐛𝐬𝐞𝐫𝐯𝐞𝐝 𝐭𝐡𝐢𝐬 𝐲𝐞𝐚𝐫 𝐛𝐞𝐜𝐚𝐦𝐞 𝐚𝐛𝐨𝐮𝐭 𝐚 𝐟𝐚𝐜𝐭𝐨𝐫 𝐨𝐟 𝟐 𝐥𝐞𝐬𝐬 𝐥𝐢𝐤𝐞𝐥𝐲. 𝐓𝐡𝐞 𝐬𝐲𝐧𝐭𝐡𝐞𝐬𝐢𝐬 𝐨𝐟 𝐭𝐡𝐞 𝐦𝐨𝐝𝐞𝐥𝐬 𝐚𝐥𝐬𝐨 𝐬𝐡𝐨𝐰𝐬 𝐚 𝐧𝐞𝐠𝐚𝐭𝐢𝐯𝐞 𝐭𝐫𝐞𝐧𝐝 𝐚𝐧𝐝, 𝐰𝐡𝐞𝐧 𝐜𝐨𝐦𝐛𝐢𝐧𝐞𝐝 𝐰𝐢𝐭𝐡 𝐨𝐛𝐬𝐞𝐫𝐯𝐚𝐭𝐢𝐨𝐧𝐬, 𝐭𝐡𝐞 𝐫𝐞𝐬𝐮𝐥𝐭𝐬 𝐢𝐧𝐝𝐢𝐜𝐚𝐭𝐞 𝐭𝐡𝐚𝐭 𝐚 𝐬𝐭𝐨𝐫𝐦𝐲 𝐬𝐞𝐚𝐬𝐨𝐧 𝐚𝐬 𝐨𝐛𝐬𝐞𝐫𝐯𝐞𝐝 𝐭𝐡𝐢𝐬 𝐲𝐞𝐚𝐫 𝐢𝐬 𝐧𝐨𝐰𝐚𝐝𝐚𝐲𝐬 𝐚 𝐟𝐚𝐜𝐭𝐨𝐫 𝐨𝐟 𝐚𝐛𝐨𝐮𝐭 𝟏.𝟒 𝐥𝐞𝐬𝐬 𝐥𝐢𝐤𝐞𝐥𝐲 𝐝𝐮𝐞 𝐭𝐨 𝐡𝐮𝐦𝐚𝐧 𝐢𝐧𝐝𝐮𝐜𝐞𝐝 𝐜𝐥𝐢𝐦𝐚𝐭𝐞 𝐜𝐡𝐚𝐧𝐠𝐞'.
So they 1) use an unofficial time period of 20 years instead of 30 years and their main finding is that the events will happen less frequently.
Frederieke Otto's World Weather Attribution is fueling all this. In this guide for journos by Otto's org https://tinyurl.com/y5nud273 - at the examples at p7 - they actually say about a cold streak in N Italy and the Alps that human caused climate change LESSENED the cold. I'm sure many will fret about that. The majority of the examples listed there show something Roger Pielke jr has also found and for which he has an explanation they don't deliver. Just read them.
Pielke is the scientist who pioneered climate attribution studies at UN Boulder CL and is a former IPCC researcher - he began a decade and a half before activist scientist Frederieke Otto (PIK, Imp College, Oxford) and has warned for the field since it can't show much. (I put the IPCC attribution chart at the bottom below).
Instead the field is used because of (p 6 https://tinyurl.com/y5nud273): ''its ability to connect novel, attention-grabbing, and event-specific scientific information to personal experiences and observations of extreme events.” Pielke jr has a similar F Otto quote here https://tinyurl.com/34dkva4t
Pielke jr How to be a smart consumer of climate attribution claims
Three rules for making sense of "event attribution" studie
https://tinyurl.com/w7wdtj9k
'(The) IPCC has employed a statistical framework for concluding that extreme weather phenomena has actually increased (or decreased) and the factors responsible for such changes. The detection of changes required quantifying a change in the statistics of weather extremes over climate time scales of 30 years or even longer.
...the IPCC has for decades been unable to conclusively detect changes in their frequency or intensity. For instance, the IPCC has reported increases in heat waves and in heavy precipitation, but not tropical cyclones (including hurricanes), floods, tornadoes or drought'.
The 3 rules:
Rule Number One: Any model used in an event attribution study to quantify a claimed linkage between climate change a specific extreme event should also produce accurate historical climate trends associated with the relevant phenomena.
Rule Number Two: All event attribution studies should be preregistered, which means “committing to analytic steps without advance knowledge of the research outcomes.”
As one event attribution study concluded: “any event attribution statement can—and will—critically depend on the researcher’s decision regarding the framing of the attribution analysis, in particular with respect to the choice of model, counterfactual climate, and boundary conditions.”
Rule Number Three: All event attribution studies should integrate their findings with the traditional approach to detection and attribution of the IPCC. Event attribution studies often result is what is called “attribution without detection.”
An example of bad attribution in the media:
'In September 2018, as Hurricane Florence was heading towards a landfall in North Carolina, a team of researchers announced that the storm would be 80 kilometers larger and drop 50% more rainfall due to “human induced climate change.”
The announced connection to climate change, predictably, generated headlines across the legacy media around the world. Many news outlets ran with sensational stories. For instance, the Guardian proclaimed: “Climate change means Hurricane Florence will dump 50% more rain.” Newsweek announced: “How Global Warming Is Turbocharging Monster Storms Like Hurricane Florence.”
One of the scientists who performed the initial Hurricane Florence analysis, Michael Wehner of Lawrence Berkeley National Laboratory, openly expressed his desire to get the initial analysis in the news.
“Wehner admitted that he and his colleagues are sticking their necks out in making an estimate of the effect of climate change before the storm makes landfall. But he said that it’s important to provide answers when a hurricane is in the news, not months later when most people are thinking about other issues.”
And indeed, his strategy fully worked since the truth came out when most people indeed were probably thinking about other issues...
'In the study published more than a year later the researchers shared that their initial numbers were actually wildly off base. Whoopsy.
“The quantitative aspects of our forecasted attribution statements fall outside broad confidence intervals of our hindcasted statements and are quite different from the hindcasted best estimates.”
In plain English that means: “We were really, really wrong.”
IPCC AR6, Climate Change Information for Regional Impact and for Risk Assessment, chapter 12
https://bit.ly/452idBO
Page 90 shows what is detected, what is attributed, and what is not. Don't hold your breath.
Have you seen the scenes in CEE?