So much has been said about the benefits of long-term investing that it is hard to come up with something new. But in a recent conversation with a friend, I think we may have stumbled on a benefit of long-term investing that is largely unknown amongst investors. And it is due to the weird nature of compound returns.
We all know that if we suffer substantial losses (in percentage terms) it takes a much higher percentage gain to break even. If you lose 50% of your portfolio, you need a 100% gain to recover your losses.
We also know that markets tend to revert to the mean in the long run, that is periods of exceptionally high returns are followed by periods of exceptionally low returns and vice versa.
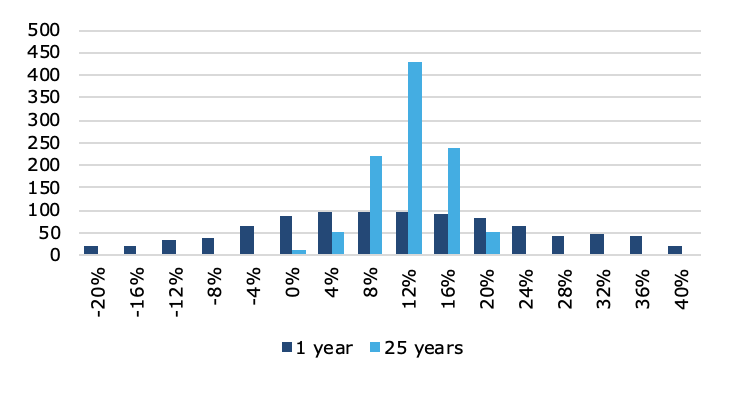
Nothing new under the sun, but let’s look at the return distribution of an equity investor who invests for 25 years or so. To make things simple, I simulate a hypothetical stock market with an annual return of 10% and annual volatility of 15%. Every year, I randomly draw the return from a lognormal distribution and compound the return over time. To get an idea of the overall range of outcomes, I simulate 1,000 such return paths.
The chart below shows the familiar return distribution after year 1. Returns are symmetrical around the average of 10% (Note for geeks: I show log-returns in this and all further charts).
Return distribution after year 1

Now, let’s compare this return distribution with the distribution after 25 years of investing. The chart below shows that the return distribution after 25 years is much narrower and more focused around the average return. My simulation did not include a mean reversion effect. This narrower distribution after 25 years is simply due to the fact that by pure chance positive years follow negative years and vice versa. Hence, long-term investors tend to recover from short-term losses over time (and lose excess returns after periods of high returns). In the long run, the returns drift towards the average.
Return distribution after year 1 and year 25

However, if we zoom into the return distribution after 25 years, we notice something strange: the distribution is no longer symmetrical. This is the result of compound returns. Because a 20% loss takes more than a 20% gain to recover, more returns are on the left side of the distribution than on the right. But, note also, that the left side of the distribution ends at returns just slightly below the average annual return, while the right side of the distribution stretches out to annual returns that are almost twice the average return. Hence, the return distribution has positive skewness (even though the original annual return distribution did not).
Return distribution after year 25

This is a wonderful gift to long-term investors. The positive skewness implies that for long-term investors, downside risks are cut significantly and while exceptionally high returns also become rarer, their likelihood declines at a slower rate than downside risks. Simply put, if you are a long-term investor and you happen to experience fewer drawdowns or bear markets than others, your long-term returns will remain significantly above the average annual return. Only if you experience a significant number of bear markets in your career do your long-term returns decline to the average annual return. And the longer you invest, the more skewed the return distribution gets, i.e. the more likely it becomes that you will end up with higher long-term returns than the annual average.
Skewness of return distribution as a function of investment horizon

Investors who started their career in the early 1980s (i.e. Baby Boomers) were amongst the lucky ones that suffered fewer bear markets in the subsequent 30 years or so, while investors who started their career in the late 1990s (i.e. Gen X like me) have by now suffered three major bear markets in twenty years. Millennials, who started investing over the last ten years or so may still be lucky. So far, they have experienced only one major bear market and who knows, maybe that is it for them. In any case, your chances of being successful increase if you stay invested.
Note: My friend didn’t believe me that a symmetrical distribution can become skewed over time, so I showed him this paper in the Journal of Financial Economics where this effect has been demonstrated for the first time (at least to my knowledge).


Hi Joachim.
Why using theoretical data? Such analysis is much more interesting and insightful with real world data, don't you think?