


Measuring successful marketing

I have an ambivalent relationship with marketing. On the one hand, I recognise that marketing is important for businesses to generate sales, but on the other hand, I feel like much of it is a waste of money. Or as the saying goes: I know that half of the money we spend on marketing is wasted, I just don’t know which half.
For a quantitatively trained, analytical person like me, the unease with marketing is rooted in the fact that it is really hard to quantify, which opens the area up for a lot of snake oil salesmen. But at least when it comes to investments, Chewie Ang and his colleagues from Deakin Business School in Australia have helped me get a step closer to a numerical assessment of marketing impact. They try to measure the efficiency of the marketing efforts of different companies in a relatively straightforward way. They start by collecting the amount of money a company spends on selling, general and administrative expenses (SGA), as well as the advertising expenses and the sales in the previous year and use that to estimate sales for the coming year. The difference between the theoretical optimal sales given the inputs and the realised sales is a measure of the waste in marketing spending. The closer the actual sales are to the predicted sales, the more effective the marketing was. However, client acquisition costs vary by industry, so they make sure companies are only compared within their industry, not across industries. After all, getting a new customer when you are a software company is much easier than when you are selling commercial airliners.
For US companies they estimate an average marketing efficiency of 88% but that ranges from 65% for the most inefficient companies to 99% for the most efficient. As you would imagine, companies with highly efficient marketing have higher growth rates in both assets and top line revenues and more expensive share price valuations. But they also have higher gross profits and higher return on assets. In other words, the companies that excel at marketing efficiency are the much sought-after quality growth companies.
And how well do these quality growth companies perform? The researchers did the usual exercise of sorting all companies by decile and measuring the performance of the top 10% minus the performance of the bottom 10% by marketing efficiency. The chart below shows the annual outperformance depending on the holding period before companies are sorted again. The outperformance rises until the holding period reaches 12 months and then plateaus off. In other words, sorting all the companies by marketing efficiency and then holding them for a year before doing the same sort again provides a good strategy to identify quality growth companies. On average, the top 10% of companies by marketing efficiency outperformed the bottom 10% by some 6% per year. Quality growth pays off and this study has just given us an innovative new way to find out which companies produce that quality growth.
Outperformance of companies with high marketing efficiency depending on holding period
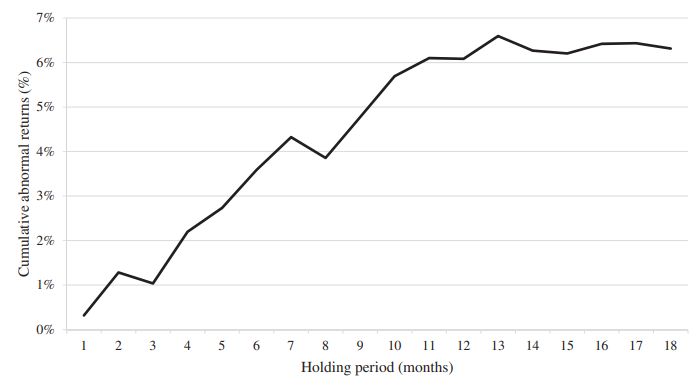
Source: Ang et al. (2022)
Not sure if it is just me, but the link to the Deakin Business school study is not working.
Sale pays!