Measuring valuation uncertainty
It is common knowledge – or at least it should be common knowledge – that value as an investment style works better for stocks that have high uncertainty about the future. If you didn’t know that the explanation is simple. If a stock has very uncertain future earnings or cash flows, there is more room for interpretation both to the upside and downside. This means that there will be a lot of disagreement between investors about the prospects of a stock. If the future then materialises (e.g. when results are published) the uncertainty is reduced and either the most optimistic or the most pessimistic investors have to revise their expectations. That means that either the most optimistic investors have to sell, driving lowering the returns of stocks with a lot of optimistic investors or the most pessimistic investors have to buy, increasing the price of stocks with a lot of pessimistic investors in the shareholder register. In either case, stocks with a lot of optimism priced in start to underperform, and stocks with a lot of pessimism priced start to outperform.
When I managed equity portfolios in the past, this kind of uncertainty was one building block of my investment process. But back then, about a decade ago when I was an inexperienced Thirty-something it never even occurred to me to test which proxy would do the best job in measuring valuation uncertainty. All I can say in my defence is that I was young and needed the results.
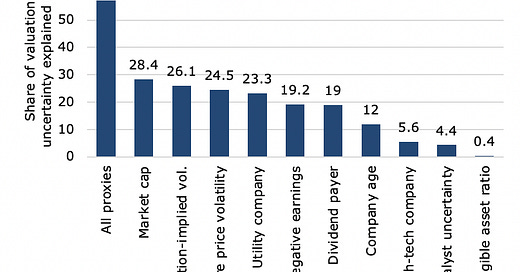
But now, Andrey Golubov and Theodosia Konstantinidi have done the job for me. They used the usual set of US Stocks in the CRSP database since 1974 and calculated the valuation uncertainty as the standard deviation of the fair value of a battery of valuation approaches. Doing this for every stock is a pretty big undertaking which is why asset managers are looking for proxies for valuation uncertainty that are easy to calculate. The chart below shows the share of the “true” valuation uncertainty explained by a range of different proxies. Obviously, using all the proxies explains most of the valuation uncertainty (c. 57.2%) but that is not possible in practice because in order to use all proxies one would need to calculate the weight of each proxy in a regression for each stock. But to do that, one would need to calculate the true valuation uncertainty for each stock first, and once you have that, there is no need to use proxies anymore.
Valuation uncertainty proxies and their relationship with true valuation uncertainty
Source: Golubov and Konstantinidi (2021)
Moving beyond the academic result of using all proxies it turns out that share price volatility explains about 24.5% of true valuation uncertainty. So my initial guess a decade ago was pretty high up there in the ranking. Higher uncertainty about valuation manifests itself in higher share price volatility as new information leads to bigger shifts in investor expectations. But it turns out that the single best proxy is market cap. Smaller companies are covered by fewer analysts and often disclose information less frequently than larger companies. Plus, they are typically covered less prominently by media so that information takes longer to move through the market and reach all investors. This is why analyst recommendations work better for small- and medium-sized companies and why value as an investment strategy works better for small and mid-cap stocks than for large-cap stocks.
Surprisingly (at least to me), simply marking utility companies as companies with lower valuation uncertainty because of the stability of their cash flows explains about 23.3% of the true valuation uncertainty between stocks. Meanwhile, marking tech and high-tech companies as companies with high valuation uncertainty doesn’t work that well at all. Valuation uncertainty doesn’t seem to be driven by growth companies with uncertain future prospects but by stable cash flow producers like utility companies.
Less surprising to me is that companies with negative earnings have higher valuation uncertainty because it is harder to estimate for investors where earnings will stabilise in the future. This is particularly relevant in the aftermath of the pandemic when many companies are moving from negative earnings to positive earnings. It is still unclear where the new earnings trend will settle in which increases valuation uncertainty and makes value strategies more effective for these companies. Meanwhile, companies that pay dividends are easier to value because dividends are relatively stable over time. Thus, these companies have lower valuation uncertainty and value strategies tend to work less well with these companies.
Finally, the seemingly most direct measure of valuation uncertainty, analyst disagreement in earnings forecasts, doesn’t work that well at all. This is an often-used measure of valuation uncertainty by asset managers but this new study shows that it is effectively a very poor proxy for valuation uncertainty.


