Some time ago, I have written about Henrik Bessembinder’s analysis of stocks with extreme returns in the past. His analysis suggests that there are a couple of fundamental indicators that can be useful to narrow down the list but even so, these factors only explain 2% of the variation in stock returns. In other words, finding the next multibagger stock based on fundamental analysis is a fool’s errand and mainly a matter of luck.
But what about using simple momentum? How likely is it that a stock that has multiplied in value fivefold does so again, and again, and again? Bessembinder’s latest paper provides some interesting answers to that question.
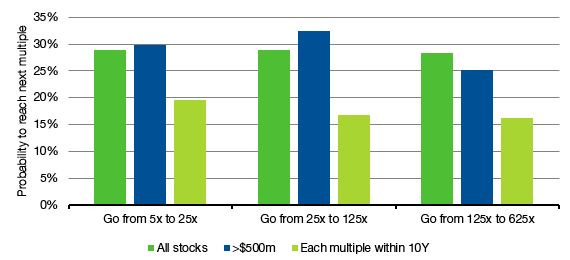
First about 45% of all stocks that listed in the United States between 1950 and 2020 managed to get to 5x their market value from their all time lows. But once a company has multiplied by five, about three in ten of these stocks go on to multiply their market value again by 5x. Of those companies that managed to multiply by 25x, about three in ten go on to multiply their market value again by 5x (now ending up with 125x the market value of their all time low). And of these another three in ten stocks multiply once more by 5x. That means that one in eight stocks manage to multiply their market value by 25x, one in thirty stocks go to 125x and one in a hundred stocks go to 25x! Restricting the sample only to stocks with a minimum market value of $500m by the time they have multiplied 5x doesn’t change these probabilities. Only if you ask how many companies do each multiplication in less than 10 years, you get somewhat lower probabilities, but even so they stay remarkably constant for each hurdle as well.
Probability of multiplying market value 5x again and again
Source: Bessembinder (2021)
So, extreme performers aren’t that rare. And because the probability of multiplying 5x when a company has done so before is relatively high, one has to wonder if one can’t just buy stocks like Apple, McDonald’s, Walmart or Franklin Resources (all of which have managed to multiply 25x from their all-time lows) and hold on to them?
The problem with that strategy is that the extreme returns are extremely lumpy as well. The chart below shows the average return vs. the market in the 10 years before a stock hits a 5x multiple. Most of the time, these stocks perform pretty much in line with the market, and only in the two to three years before they eventually hit their 5x multiple do they start to outperform. And even so, almost all of the return comes in one year.
Average return vs. market in the years before a stock hits 5x
Source: Bessembinder (2021)
But if the first multiplication “announces itself with a couple of years of outperformance vs. the market, what happens after a stock hits 5x should make you worry. Returns are all over the place in the ten years after that. There simply is no “long-term momentum effect” that would ensure that stocks that have done extremely well in the last decade will continue to do so in the next few years or even the next decade.
In the end, it all boils down to the same message once again: Finding extreme performers is a matter of luck not skill.
Average return vs. market in the years after a stock hits 5x
Source: Bessembinder (2021)


Instead of thinking in terms of "singular" multi-bagger situations, one may instead, want to think in terms of a diversified multi-bagger "portfolio". A simple portfolio construction based on three equity asset classes has produced steady "multi-bagger" returns ( over seventeen 20 year rolling periods since 1986), averaging an equivalent 11X multiple growth ( chart 1 Apoendix https://tinyurl.com/c39hr65k ).
Thanks for this, Joachim. After the first 5x, might further multiples of 5 be explained by fundamental analysis? Could there be a correlation with revenue growth (or asset growth) for example? Peter