It’s only April, but in a couple of weeks, I am sure someone will ask me to write about “sell in May” or something like that. Even worse, I know “market strategists” who frequently show seasonality charts for the stock market to explain why they expect a rally or weakness in the market. If you are paying money for this kind of “advice”, here is my top tip: Run. You are throwing away your money.
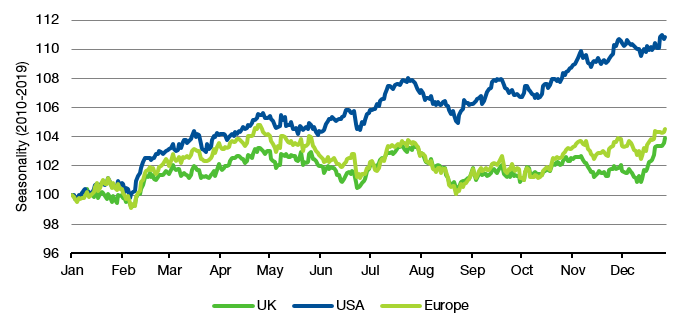
Seasonality charts have something wonderful to them. Just like simple rules like “Sell in May” they seem to be tapping into the underlying market dynamics and provide certainty in an uncertain world. If you look at the average seasonal pattern of the US, UK and European stock markets from 2010 to 2019, seasonality indeed seems to have something going for it.
Average seasonality from 2010 to 2019
Source: Bloomberg
Note that I excluded the pandemic years 2020 and 2021 from the seasonality chart above because Covid and the subsequent lockdowns clearly messed with regular seasonal patterns that investors try to chase.
But over the last decade, seasonality seems to have worked broadly similarly across regions. There was a rally at the start of the year that lasts until May with a short period of weakness in early February. Then comes the summer lull that is interrupted by a short rally in July and August, but overall, markets are moving sideways to down before accelerating again in October to December.
Simple, isn’t it? Yes, it’s simple – and absolute nonsense.
The chart below shows the true seasonality for the UK market for the years 2010 to 2019. Finding a seasonal pattern in that data is about the same as finding lions and mountain goats in the night sky. If you look long enough you can see anything you like.
“Seasonality” in the UK from 2010 to 2019
Source: Bloomberg
And relying on stock market seasonality is about as reliable as asking an astrologer to give you stock tips. Let’s take the famous Sell in May rule. In the US, the rule is “Sell in May and come back on Halloween” (31 October). In the UK, the rule is “Sell in May, come back St Leger Day”. The problem with St Leger Day is that it changes every year but always in September. In 2022, it is the 10th of September.
But if we use the US definition, then over the decade from 2010 to 2019, selling in May and coming back on Halloween would on average have let you miss out on a massive drawdown of 0.7%. Of course that is not only not statistically significant but completely misleading. In the 10 years from 2010 to 2019, Sell in May would have spared you losses in five cases while you would have missed out on gains in five cases as well. The Sell in May rule was literally as good as a coin toss. In fact, the losses you would have avoided by following seasonality range from -2.1% in 2019 to -9.3% in 2011. But the gains you would have missed out ranged from 0.7% in 2012 to 10.1% in 2016.
You might argue that the whole purpose of averaging markets over several years is why seasonality provides information. But if the average has absolutely no relation to any individual year, what is the use of these averages? So, the next time you see someone talk about seasonality in stock markets, ignore him (or her). You have just been given bad advice.


Very interesting! Dear Joachim, to what indexes you refer when you put US, Uk and Europe market to the chart ? Thank you in Advance,
Seasonality is one of those tools that have so many ways of distorting data or presenting results in a bad way. It starts with how many years of history you are looking at, e.g. are you considering the last 15 years in US stocks as being the new "normal" or are you choosing a longer timeframe? Next, the number of observations is very small, especially if you believe that market characteristics change over long periods of time. And there are huge outliers in single years like 2008 or 2020. Calculating seasonality based on the median of observations and not on the mean to filter out this effect leads to a completely different pattern. And the list goes on.
There's a small number of seasonalities that make sense. JPY strength after the end of the fiscal year on March 31 in Japan is one that comes to mind. But even that is not working every year (like right now) despite a sound reason behind it.