

Past tail risk is not a good indicator of future tail risk

The insurance industry and other institutional investors are increasingly focused on tail risk protection. This has gone so far that Solvency II regulations require insurance companies to hold solvency capital reserves that increase in response to rising tail risks. Similarly, both pension funds and wealth managers monitor value at risk and there are several asset managers and wealth managers out there that have designed investment products that reduce risk as value at risk or tail risks rise and increase risk as value at risk or tail risk declines.
The unfortunate thing about these products is that you should do exactly the opposite.
Past tail risk is not a good indicator of future tail risk and as a result, episodes of rising tail risks are usually followed by episodes of falling tail risks. Our chart shows the average tail risk of the stocks included in the FTSE 100 index over the last 15 years together. I have calculated the rolling 100-day value at risk for a 95% risk level, i.e. the chart shows the daily decline in share price that would have been surpassed in 5% of the last 100 days. I have superimposed this measure of tail risk on the return of the average stock in the FTSE 100 over the subsequent 100 trading days. It is easy to see that periods of high tail risk were followed by periods of high returns afterwards. The reason is simple. When stock markets correct, investors get exceedingly worried about “extreme risks” and potential “black swans”. In this environment, valuations decline and return expectations increase. If the anticipated extreme event does not materialise, stocks recover.
This pattern has been observed not only in the last 15 years covered by the chart below but for many decades. The only time when higher tail risks led to lower returns were during long drawn-out recessions like the financial crisis 2008/2009 and the extended bear market of 2000 to 2003. But during a typical recession like the one in the early 1990s or the recessions of the 1980s as well as during a typical market correction (e.g. Eurozone debt crisis 2011, the oil crash in late 2015 or the correction of Q4 2018) high tail risk is indicative of high future returns, not low future returns. Investment strategies that reduce risk in reaction to rising tail risk thus fare well, if we will experience a repeat of the financial crisis, but will fall into the same trap as portfolio insurance products did in the aftermath of the stock market crash 1987: their rule-based investment strategy will force them to reduce risk dramatically right as markets bottom. Thus, these strategies create a double whammy for investors. First, they are fully invested in risky assets as the tail risk hits the market, then they are out of risky assets as markets recover.
Regulators and product developers in the financial industry always seem to invent solutions that would solve the last problem we had, but not the next problem we are going to have…
Past tail risk is not indicative of future returns
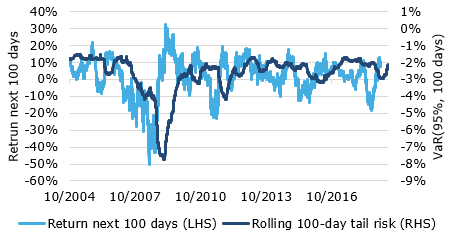
Source: Bloomberg.