US stocks are trading at high valuations while US Treasuries now offer more than a 4% yield. Does that mean we should prefer bonds over stocks in the next decade? Not according to this metric.
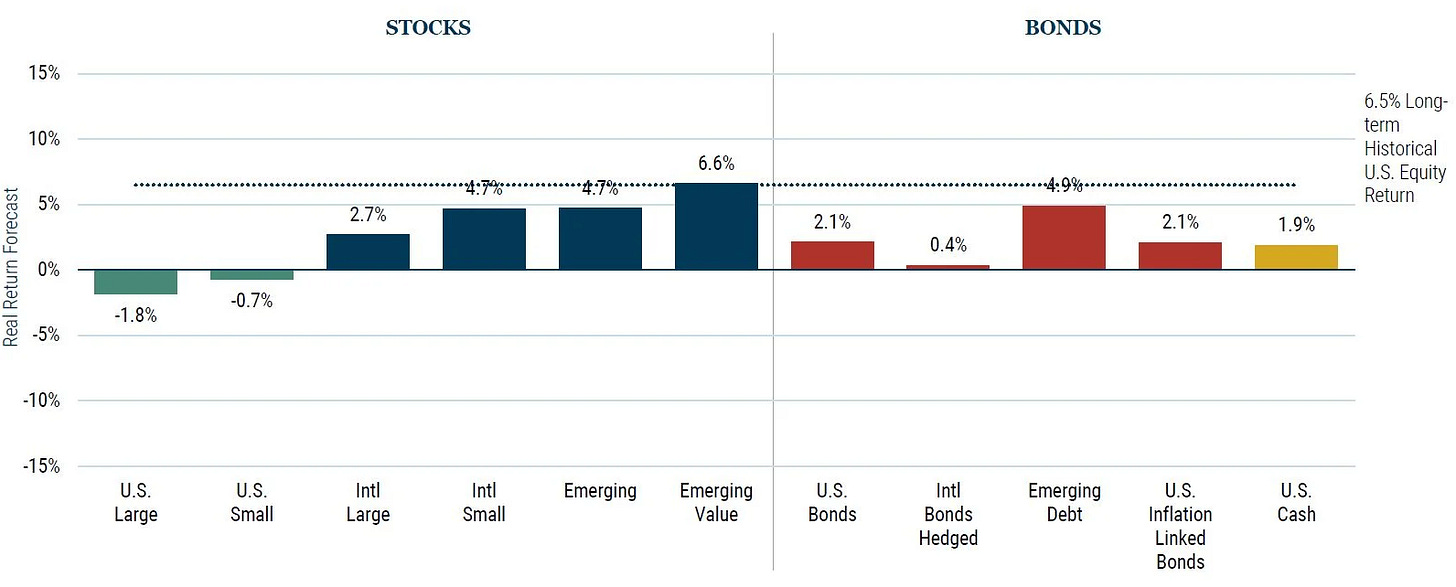
If you look at the 7-year return forecasts of GMO below, you could be forgiven if you decided to sell all your US stocks and hold just US bonds. After all, the S&P 500 is trading at 20x forward earnings, and other valuation metrics light up amber, if not red as well. And now we can buy 10-year Treasuries and hold them to maturity earning a guaranteed return of more than 4% per year or some 2% real (the return forecasts in the chart below are real returns after inflation). Time for long-term investors to ditch stocks then, it seems.
GMO 7-year real return forecasts as of Q3 2023
Source: GMO
Let’s sense-check these return forecasts with a simple model that has a good track record: the Fed model. The Fed model compares the earnings yield of the stock market with the real bond yield of government bonds.
Some people use nominal bond yields instead of real bond yields but that is wrong since both earnings and share prices are nominal, and hence the earnings yield (earnings divided by prices) is a real number that is independent of inflation. Hence, one must compare a real number with a real yield, not a nominal yield that changes as inflation changes.
But this geeky remark aside, the claim is that if the earnings yield of the stock market is low relative to the real bond yield, equities are expensive vs. bonds. And when you start with a relatively expensive equity market, you would expect that after the fact, equity market returns compared to bond returns should be relatively low if not negative.
The chart below shows the relative return of US stocks vs. US Treasuries over ten years depending on the difference between earnings yield and real bond yield at the start of the period. There is a nonlinear relationship between starting valuation differences according to the Fed model and subsequent relative returns.
The Fed model and subsequent relative returns between stocks and bonds in the US
Source: Liberum, Bloomberg
And lest you think this relationship is unique to the US, it also works in the UK as the chart below shows).
The Fed model and subsequent relative returns between stocks and bonds in the UK
Source: Liberum, Bloomberg
In both charts above, I have added the current starting value of the difference between earnings yield and real bond yield. And though the US equity market is expensive while the UK equity market is cheap (trading at c.10.5x forward earnings) both charts come to a similar conclusion. Based on the historic relationship shown in these charts, we would expect stocks to outperform bonds by about 4.5% per year over the coming decade.
Yes, US equities are expensive and the difference between earnings yield and real bond yield is small at 2.1%. But even at these low valuation differentials, US equities have historically been able to beat bonds handsomely. So, while bonds definitely should play a role in a diversified portfolio and while bonds offer good value for income investors right now, long-term investors in my view should still prefer stocks over bonds.


The real price of money, as expressed in interest rates, has been circa 3% for thousands of years (see p. 5 of this https://1drv.ms/b/s!At9od58qwtRei8BXD8M2bV2lxxMOiQ ). Why don't peole talk about the "equity risk premium" anymore?
Apropos your recent work on Cassandras, as a young peson on Wall Street, I asked an older co-worked why people in "fixed income" (I think it's sometimes lost on people how key that department title is) seemed to be grumpier than equity people, and an older colleague said, "kid, an equity person has a great day when a stock he owns goes up 20% in one day or becomes a ten-bagger ...a bond bore has a great day when he gets his principal back."
Would add a detail that the difference between the equity return, the earnings yield, and the [close to] risk-free bond return is the real [equity] market risk premium. This is believed to reflects of unstable fluctuating investor psychology on future returns and leads to the general adage that buying rich is less profitable, on average, than buying cheap [or sell high, buy low...]. The trick is both to exit expensive and reinvest cheap at the 'right points of time and not miss the major moves in valuation in between that drive returns - effective market timing is a b_tch to pull off.*
* Employing the current, average, CAPE, etc. earning yield as a proxy for the expected future equity returns. Next level of difficulty and more assumptions would be to use the implied equity market returns over 10 years but I believe would give directionally similar results.