The 52-week high glass ceiling
It’s been almost 20 years since I first published a research note examining some simple chart analysis indicators and I still remember the amount of hate mail I got for publishing that. Granted, I was working at a firm back then that prided itself on fundamental analysis and value investing, so I probably should have expected a backlash.
But I have always been open-minded about chart analysis. If it helps me improve performance, I will adopt it and techniques such as stop losses have done wonders for my performance. And as our ability to collect large amounts of data increases, we are getting more and more evidence that some chart analysis techniques work.
Take the 52-week high of a stock as an example. Traditional chart analysis would say that this is a natural resistance for a stock since investors have anchored the performance of a share vs. its most recent performance. And the 52-week high and low as well as the 200-day moving average price are amongst the most prominent of these psychological anchors. Chart analysts would tell you that at the 52-week high many investors will want to sell their stocks in order to lock in their profits at that salient anchor. Thus, selling pressure increases and the share price often bounces lower from this psychologically important level. Only when there is sufficient buying pressure (e.g. due to positive fundamental or macro news) will the share price break through that resistance and move above its 52-week high.
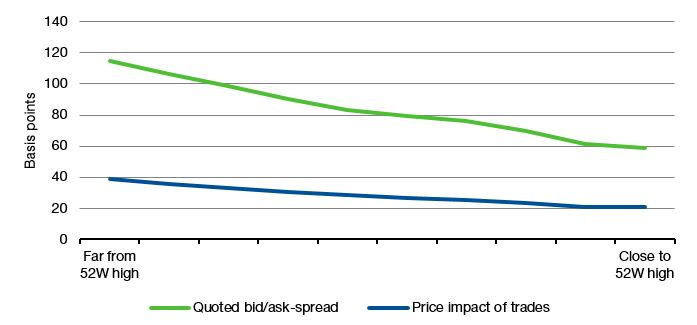
According to analysis by Joshua Della Vedova and his colleagues, that explanation is pretty close to what plays out in reality. They collected every single trade on the 78 stocks in the Finnish OMX index from 2000 to 2015 and analysed price action and liquidity around the 52-week highs. They found that as the share price closed in on the 52-week high the liquidity in each stock increased significantly and the bid/ask-spread declined. However, closer analysis of the liquidity in the market showed that it is the ask-side (i.e. the investors who want to sell shares) that increased and in fact doubled, while the bid-side remained roughly unchanged. Thus, selling pressure roughly doubles as the share price closes in on its 52-week high.
Meanwhile, trades made at or close to the 52-week high become less impactful, i.e. the share price reacts less to fundamental and macro news than at other times. The average change in share price after a trade is roughly cut in half and the persistent share price impact over longer time frames declines by two thirds as a stock closes in on its 52-week high. In a nutshell, psychology takes over as the shares approach the psychological anchor and fundamentals become less influential. Thus, chart analysis starts to work…
Bid/ask-spread and price impact of trades as a stock approaches 52-week highs
Source: Della Vedova et al. (2021)


