

I once wrote a post arguing that the social cost of carbon is a number we all should be more familiar with. It measures the costs to society (discounted to the present day) for current and future greenhouse gas emissions. It’s a cost that is not borne by businesses or households that emit these greenhouse gases, but by society overall (read: taxpayers) in the form of higher healthcare costs, rising damages from extreme weather like floods and decline of quality of life due to environmental degradation. It is a measure of market failure due to markets not including all costs that a business incurs in its normal operations. And these costs can be high.
Before I discuss the results of a new paper by Lubos Pastor and Robert Stambaugh, let me tell you something about these guys, in case you are not familiar with them. These two are gods of finance. They have been working together at the University of Chicago, the traditional bastion of free market economics and shareholder value maximisation for decades. Their research on topics like the term structure of risk premia has been incredibly influential in the investment world, and I wouldn’t be surprised if they eventually win a Nobel Prize. When they publish a study, it is always of the highest quality, and investors need to pay attention.
Ok, so their latest study, done with Lucian Taylor from Wharton, investigated how large the burden is that US companies put on society with their carbon emissions. In their note, they look at the scope 1 (i.e. direct) emissions of US businesses as well as indirect emissions captured in scope 2 and scope 3. To keep things simple, I will restrict myself here only to the direct emissions captured in scope 1 and ignore all the rest. As you might imagine, if you include indirect emissions, the carbon burden from future emissions is much bigger than the numbers I will discuss below.
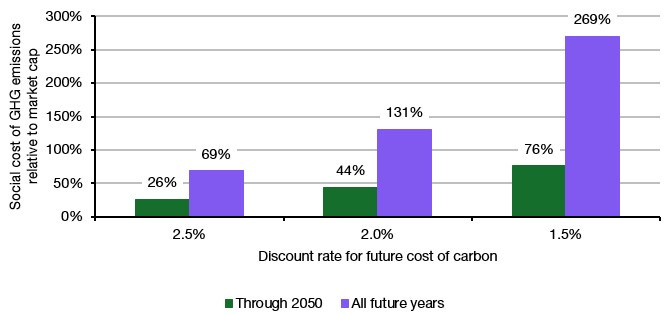
Their headline result is shown in my first chart below. It shows the estimated cost of future carbon emissions of US companies relative to their market cap at the end of 2023 (the baseline year of the study) for a discount rate between 1.5% and 2.5%.
Note that the discount rate typically used by experts and governments outside the US is 2%. This was also the discount rate the EPA used until President Trump came into office for the first time. Then the US started to use a 3% discount rate, which has the effect of dramatically reducing the net present value of future greenhouse gas emissions, as I have explained in the post linked above.
Carbon burden vs. market cap in the US for different discount rates
Source: Pastor et al. (2026)
As you can see, for the commonly used 2% discount rate, the net present value of US greenhouse gas emissions from businesses alone (excluding emissions from private households, etc.) from 2023 to 2050 amounts to 44% of the total market cap of all stocks listed in the US. If all future emissions are taken into account, the net present value of future greenhouse gas emissions exceeds the current value of the US stock market by 31%.
If one uses a higher discount rate, the carbon burden becomes smaller but remains a substantial share of the current total US stock market capitalisation.
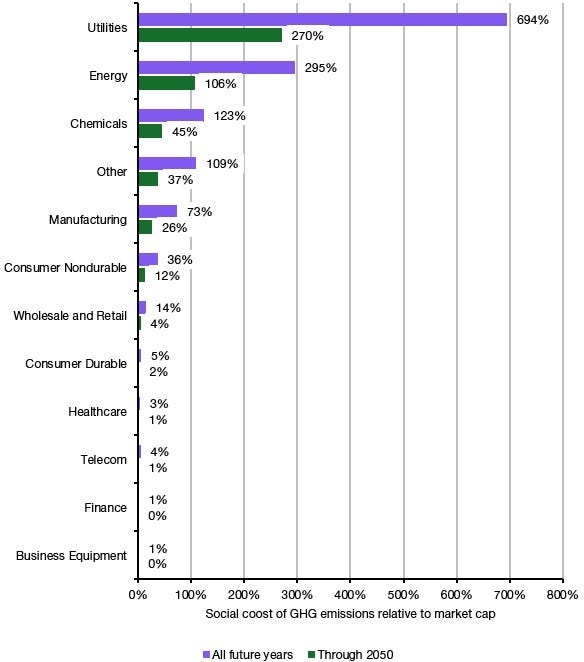
Of course, the carbon burden is not equal for companies in different sectors. The authors of the study use the 12-industry classification of Fama and French, which is a weird one never used outside of academia, but alas, that is the data we have. The second chart shows the carbon burden for each sector using the common 2% discount rate for the present value of future carbon emissions. As you can see, the carbon burden is heavily weighted towards high-emissions industry in utilities, energy, and chemicals.
Carbon burden vs. market cap by industry
Source: Pastor et al. (2026)
Why does this matter? Because if a government were to introduce a cost for carbon in order to internalise the externality caused by business activities, the numbers indicate that companies in the US utilities, energy and chemicals sectors would effectively be worthless or close to worthless.
Climate sceptics like to argue that the reason why climate science is so popular is that this is where researchers get their funding from. But if you look at the numbers above, you might well say that the reason why executives of energy and utility companies fight climate regulation tooth and nail is that the costs for them would be disastrous.
To be sure, the researchers point out a couple of caveats to their results. First and foremost, we can’t blame utility companies alone for creating the emissions they do. After all, it is our need for electricity that drives the emissions of utility companies. Second, there is significant uncertainty about the future emissions of these companies because we don’t know how fast and how much these businesses will decarbonise.
But one thing is clear. There is massive market failure when it comes to the collective cost of doing business that is simply not reflected in the share price of businesses. Or to quote the authors: “Firms’ large carbon externalities suggest that a continued debate regarding the Friedman (1970) doctrine, according to which firms should focus solely on maximising profits, is warranted.”
Great post! Shared it with my sustainable investing course for discussion.
Excellent piece Joachim, thanks.