


The difficult task of CO2 accounting

Tackling climate change is a key challenge for this decade. In order to do that, nations across the globe have to reduce their CO2 emissions significantly. However, while we know how much CO2 is in the atmosphere, we have a much harder time finding out how it got there.
Below is the CO2 emission in the Earth’s atmosphere, going back a cool 800,000 years. I have plugged together three different data sources from the Antarctic to get to this graph. The word unprecedented gets thrown around a lot these days, but in this case, I think it is warranted. Humans are on this planet only for about 250,000 years and today we have the highest concentration of greenhouse gases on the planet for at least 800,000 years.
CO2 concentration in the atmosphere over the last 800,000 years

Source: Luthi et al. (2008), Etheridge et al. (2010), NOAA.
So, we know what’s around, but who is responsible for these CO2 emissions? The chart below shows the CO2 emissions of each country in 2016. Each country is rescaled so that the size of the country represents the total CO2 emissions and the colour of the country represents the CO2 emissions per capita. While China is the biggest emitter of CO2 in the world, its emissions per capita are significantly lower than the United States, Australia or the Middle East.
CO2 emissions 2016
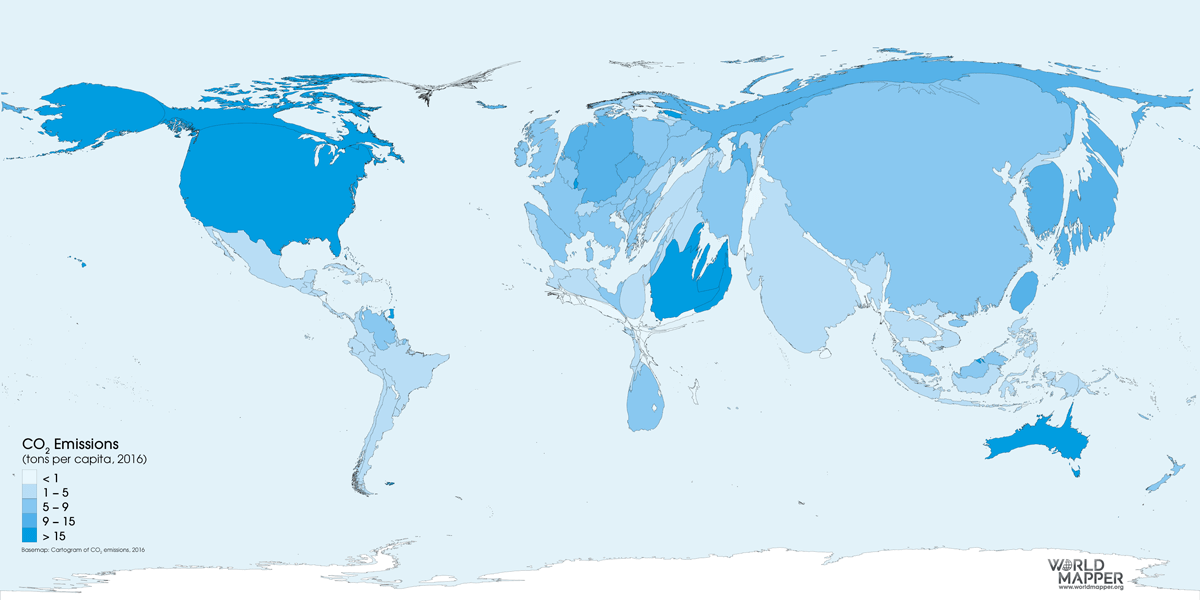
Source: Worldmapper.org
The problem with the chart above is that it relies on national estimates for CO2 emissions and those are far more difficult to make than one might expect. Knowable Magazine has a great article that discusses the issues with CO2 accounting that is worth reading in its entirety. Basically, it boils down to three major elements:
The use of fossil fuels for industrial purposes has been monitored for a long time. Thus, we can track reasonably well, how much oil gets used in a country and what percentage of that gets burnt etc. Nevertheless, there are still significant estimation errors to keep in mind. Apparently, in one year, China’s CO2 emissions were overstated by 14% because the analysis assumed a lower quality of coal had been used in their power plants. A 14% error in one year may not sound like too much until you realise that in the case of China, this error amounts to the total annual emissions of Germany.
What is more difficult to measure are the CO2 emissions of private households. We simply don’t have a good statistical grip on household activities to get a good measurement of CO2 emissions. Yet, households typically are responsible for about one third of the total CO2 emissions of a country. The best we can do today is to survey a representative sample of households and their daily habits and then try to calculate a national aggregate from that.
Finally, and most crucially, less than half of CO2 that is emitted ends up in the atmosphere, while the rest gets absorbed in the oceans and the ground. Unfortunately, as ocean’s heat up, they can trap less CO2 and thus become a CO2 emitter in their own right. And as the permafrost in Siberia and Canada starts to melt, it releases large amounts of CO2 as well. So far, we do not really know how much CO2 is emitted from warmer oceans and thawing permafrost – and how to account for that on a national level. Are Canada and Russia going to be held responsible for the CO2 emitted by thawing permafrost? Can you hold a country to account for something that is beyond its control?
In any case, CO2 accounting on a national level is about as tricky as national accounting for GDP, for example. Except that we have decades of experience with estimating GDP. Over the coming decade, CO2 accounting has to improve and organisations like Climate Action Tracker and the International Energy Agency are working on that. Even the European Space Agency is chiming in since it aims to launch a bunch of satellites in 2025 that will be able to track every corner of the planet every three days and resolve CO2 emissions down to 2km distance. My guess is that we will see a lot of surprises once we get that data because today, the incentive for many countries is simply to put lipstick on their emissions pig and massage the data in order to reduce the estimated CO2 emissions.
International organisations rely on the statistical data for energy usage, imports and exports of fossil fuels, etc. to estimate the greenhouse gas emissions, but countries that produce coal and gas domestically, for example, can simply under-report the domestic production of these fossil fuels and then burn them without anyone ever being the wiser. Once satellite data is available these discrepancies will become visible, just like satellite data allowed for an independent estimate of GDP growth in countries with let’s say questionable economic statistics. What this means for investors is that CO2 emission certificates, which are already introduced in Europe and will be introduced nationwide in China this year, may all of a sudden become much more expensive. Given that CO2 certificates may already be an interesting investment for this decade since decisive climate action requires a price of carbon that is significantly higher than the current price, the price for these emission schemes may have a significant upside risk from these improvements in carbon accounting.