


The limits to growth… are coming closer

Before you read this, a word of caution. You may want to prepare yourself a stiff drink and sit down before you read the following.
I think most people who read this will at some point in their life heard about the Club of Rome’s Limit to Growth publication from the 1970s. Back then, the Club of Rome asked the MIT to produce a series of forecasts for the world’s industrial and services output, food production, and pollution levels to the year 2100. Almost from the get-go, these forecasts were derided as scaremongering and flat out wrong. But were they really?
Importantly, the Limits to Growth model never predicted what many people think it did. The model never predicted an end to growth around the turn of the century or sooner. But the fact our industrial output, food production, etc. continued to grow after that was often claimed as proof that the model failed.
Here is what the model actually predicted. The scientists at the MIT modelled three scenarios: business as usual (what was then called ‘standard run’), a technologically enhanced world where technological progress eliminates most limits to growth, and a stabilised world where our economies shift to a sustainable (i.e. non-resource consuming) model by the turn of the century.
The original scenarios of the Limits to Growth model

Source: Turner (2008)
In 2008, Graham Turner compared the forecasts for the first 30 years (1970 to 2000) with the observed data and found that the business-as-usual scenario fit the observed data until then very well.
Here is the fit for the first 30 years for industrial output.
Industrial output: Model vs. observed 1970-2000

Source: Turner (2008)
And here is the corresponding chart for food production.
Food production: Model vs. observed 1970-2000

Source: Turner (2008)
And finally for persistent pollution (essentially CO2 concentration)
Persistent pollution: Model vs. observed 1970-2000

Source: Turner (2008)
Ok, so until the turn of the century, we hadn’t made much progress in deviating from the projected path. But since then, we have seen significant technological progress and our focus on environmental protection has increased. So, how do these models fare today?
This is where Arjuna Nebel and his collaborators have provided us with a true horror story.
In 2023, they went back to the original Limits to Growth model and recalibrated for the best fit with observed data. If the recalibrated model deviates significantly from the forecasts of the 1970s, we have made progress. And given the accuracy of the original model, we can also take some comfort that any progress we made is likely to be real and we have truly extended economic growth further into the future.
So here are some of the key forecasts with the recalibrated model. I have shaded the original forecasts in light grey and in dark grey the new forecasts. Note that we are in year 2025 now, so you can look at what the model says is going to happen over the next 25 years to 2050.
Here is industrial output: No progress made since 1970. We are still on track for peak global industrial output right about now. But this might not be such a big deal. After all, we have shifted our economies from a manufacturing model to a services model, so if service output increases, industrial output can decline, and we still get progress and more growth.
Industrial output: Recalibrated forecasts
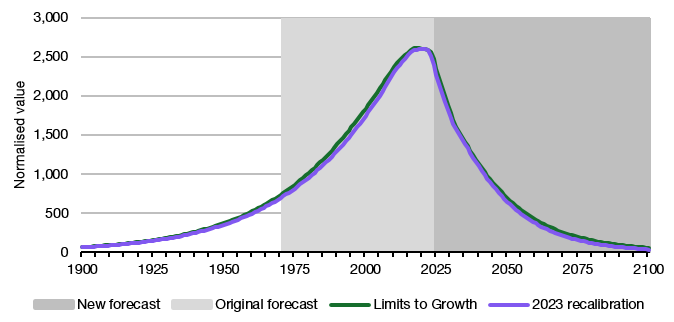
Source: Nebel et al. (2023)
Food production: This also seems to be peaking right about now indicating that despite continuous growth in the global population, we are experiencing declining global food production. That’s a problem, because implicitly it means there will be more starvation and malnourishment in the world going forward.
Food production: Recalibrated forecasts

Source: Nebel et al. (2023)
Here is the good news. We seem to have permanently slowed the growth in persistent pollution and CO2 emissions. Unfortunately, though we seem to be on track to ultimately emit much more pollution than previously projected.
Persistent pollution: Recalibrated forecasts

Source: Nebel et al. (2023)
And finally, the icing on the cake. Unlike in 1970, we now have the concept of the human development index which measures not just economic welfare but also social achievements like literacy, health and life expectancy, etc. Here is what the original model and the recalibrated model forecast compared to the available data from the United Nations.
Human development index forecasts

Source: Nebel et al. (2023)
And this last chart is really shocking. If it is true, it says that today is peak human civilisation, from now on we are going backward on a global level in terms of human development and quality of life, While some countries will continue to improve, other countries and the planet as a whole will start to go backward, ultimately dropping back to similar levels of human development and quality of life as in 1900 by the end of this century.
Now this really sucks. And for once, I truly hope these forecasts are wide off the mark.
So, reading between the lines it seems you may be reinforcing the old saying that the real purpose of economic and social forecasts is that we can prove them incorrect at some later time. Personally, I gave up trying to predict anything and do my best to react to the situation I find myself in. I think most of us will get to that with time. My hope - if most of us look after our own patch, and let others do the same, we'll all be ok.
gonna throw my book at you, feel perfectly free to ignore like everyone else
https://www.amazon.com/CIVILIZATION-CANNOT-PERFECTED-Marshall-Lentini/dp/B0CSWRLRND