The state of diversification is worse than you think
For most of my career, I was working in wealth management of some sort or another. One of the empirical findings that you come across there again and again is the shockingly concentrated portfolios investors hold. A study of the portfolios of 78,000 US households in the mid-1990s shows that the average number of stocks held in a portfolio was 3.9. People who have bigger portfolios tend to have more stocks, but even for portfolios worth more than $100,000, the average number of stocks is still only 11.7. This data may seem outdated to some of you, but I can assure you that I have seen internal analyses from private banks over the last decade that show similar numbers.
Average number of stocks in household portfolios

Source: Ivkovich et al. (2004).
With such a low number of stocks in your portfolio, the lack of diversification exposes investors to severe risks if one of their stocks tanks. However, if you find that holding just a few stocks in your portfolio is bad, you need to be aware that the experience of the average investor is probably even worse, because the average investor holds even fewer stocks than that in their portfolios.
In order to understand this, let me explain this in terms of my daily commuting experience in London. According to official statistics, 65.1% of trains in the UK arrive within one minute of their scheduled time. Then why does it feel like every other train is freaking late?
The problem is that trains do not come in regular intervals. Sometimes the gap between two trains is bigger sometimes it is smaller. Of course, I am more likely to catch a train that has a bigger gap to the previous train than a train that comes shortly after another. And so is everyone else.
As a result, delayed trains have more passengers on them than the trains that are on time. The later the train, the more passengers it carries. In the end, more and more people individually experience delayed trains in the UK, even though from a top down perspective, two out of three trains are on time.
Now imagine a situation with ten investors. Nine of these investors have a portfolio with just one investment, the stock of company X. The tenth investor has a portfolio of 61 stocks, one of which is company X. In his portfolio, each of the 61 stocks has the same weight. The average number of stocks held in a portfolio is 7 (9 * 1 + 61 = 70, divided by 10 investors).
If company X has a major earnings disappointment and the share price drops 10%, what will be the average loss experienced by investors in their portfolios? A naïve observer would have estimated that the average loss of the 10 investors would be somewhere like 10%/7 = 1.42%.
But the average loss experienced by investors is in fact more than six times as large. To be precise it is 10% for nine investors and 10%/61 = 0.16% for the tenth investors for an average of 9/10 * 10% + 1/10 * (10%/61) = 9%.
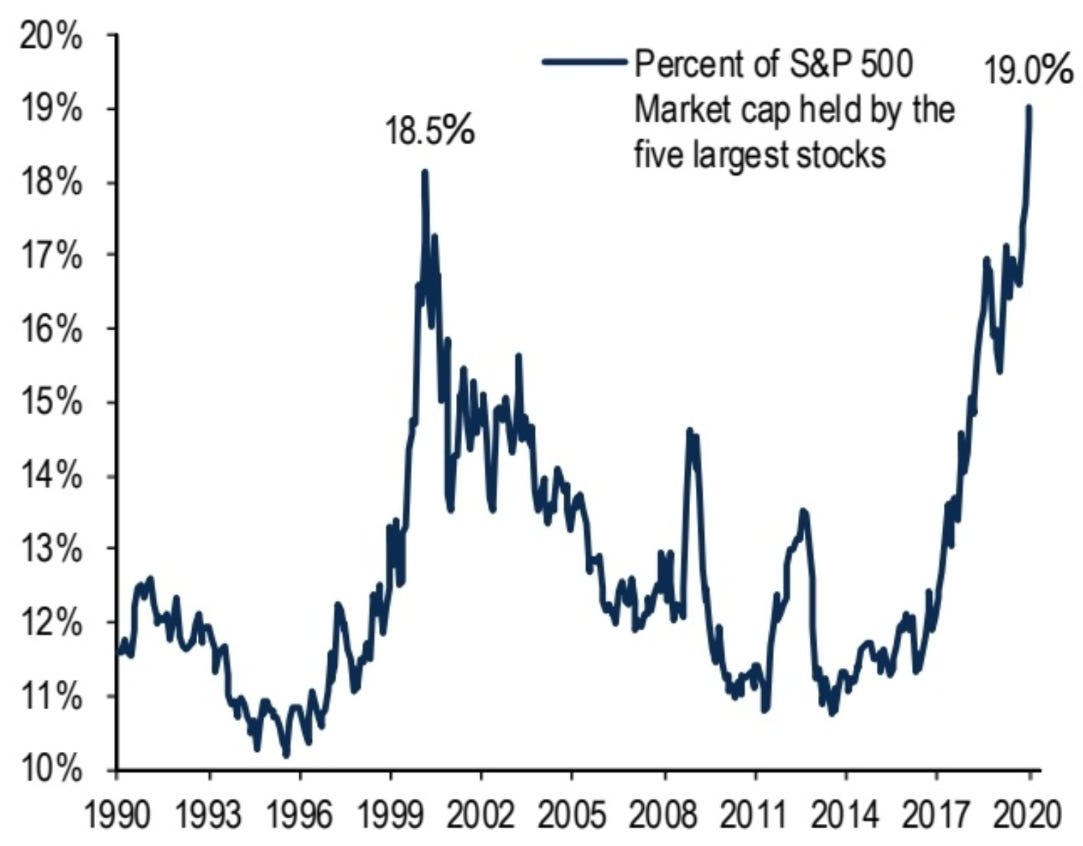
This can have serious implications, for example when a company goes bust and the majority of its employees are invested in the company stock (Enron, anyone?) or when the housing market turns south all the while the majority of households have their wealth predominantly invested in their own home. This is why housing crises are so devastating for the economy and why a share price collapse of a few companies that are held by many households can trigger a recession. Before the burst of the tech bubble in 2000, we thought that a stock market decline cannot trigger a recession but that is exactly what happened. Stocks widely held by the public in concentrated portfolios collapsed and investors had to scramble to cover their losses by reducing their consumption and spending. If you saw the recent trend towards more concentrated stock market indices where a few stocks made up for a larger and larger share of the total, one might wonder how bad the state of household portfolios is after the March market crash?
Weight of top five stocks in the S&P 500

Source: BofA Global Research, Bloomberg.


