


The yardstick matters

They say what gets measured gets done, but what gets done also depends on how it gets measured. Investors forget about this all too often when they look at data. The size and growth of corporate profits depend heavily on the accounting rules used to calculate them, which is why equity analysts are constantly adjusting financial statements to common rules.
But when it comes to macroeconomic data, investors typically take them at face value. Even though indicators like the number of new jobs created or GDP growth are subject to sometimes large revisions, the market reacts only to the initial estimate and then ignores the revisions. This is also the reason why many backtests of investment strategies based on macro variables fail. The researchers use the macro variables as reported whenever they download it from Bloomberg or Datastream and ignore the fact that at the time of first publication, the variables might have been vastly different. Hence, they discover correlations between the economy and investments that aren’t there and overlook others that are there.
But the pitfalls of measurement go beyond mere revisions. Inflation and GDP are both variables that are notoriously hard to estimate and depend heavily on local definitions. For example, inflation in the United States includes owner equivalent rent as a 25% component of the CPI basket (owner equivalent rent is the hypothetical rent a homeowner would pay if she rented her house). This means, that rising house prices lead to rising rents, which in turn creates higher inflation. In Europe, on the other hand, housing costs are excluded from the inflation basket. Robeco has recently estimated the inflation in the United States as if it were calculated with the European rules and lo and behold, the inflation differences between the United States and Europe that we observed over the last decade almost disappear.
Now think about the fact that both the European Central Bank and the Fed use inflation as the main variable they target with their monetary policy. Would the Fed have been more aggressive if they measured inflation the same way as the ECB does? Would the ECB have cut interest rates into negative territory if it measured inflation the way the Bureau of Labor Statistics does in the United States?
US inflation as measured and as if measured by European HICP rules

Similarly, GDP is a variable that changes if you measure it differently. GDP is usually measured on a cost basis, i.e. it is measured based on the amount consumers pay for a new car or for their banking services. But in the 21st century, more and more services are provided for free. Especially in the IT world, apps like Facebook, Google Maps (or Apple maps if you use that) are all free, but they clearly provide a valuable benefit for its users. Is the GDP contribution of the Facebook app really zero as the official statistics presume?
If one would use GDP not based on the cost of products and services rendered but on their perceived benefits for consumers, economic growth might be very different from what we observe today. In a new study, a group of economists has tried to estimate what benefit these free apps and services might provide to an economy. To do this, they asked a large number of consumers what they were willing to pay for Facebook, Maps, and other apps if they had to pay for it. Based on this willingness to pay, they could estimate the monetary benefits of each app on a macroeconomic scale. The chart below shows the GDP-B estimate for these apps for every ten million users (GDP-B meaning GDP measured based on the benefits for the economy rather than the costs).
If WhatsApp adds ten million new users, the estimated GDP growth would be a whopping 4.1% on top of whatever the economy does elsewhere. If Facebook adds ten million new users, GDP growth in this methodology would be boosted by 0.5% and so on.
Estimated growth contribution per ten million new users as measured by GDP-B
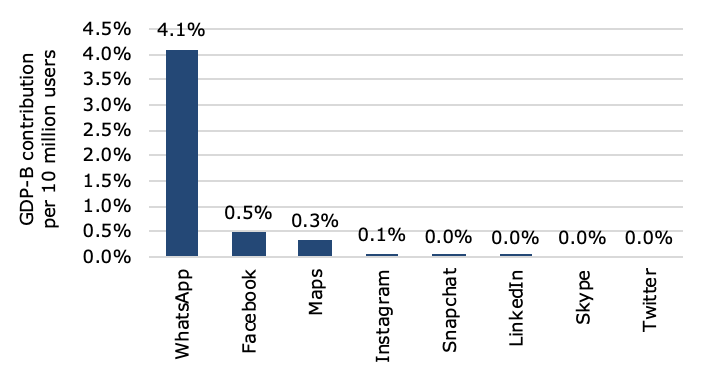
Source: Brynjolfsson et al. (2019).
Obviously, this is just one estimate of the true value of WhatsApp and co. but think about it. Would we really be arguing about secular stagnation and the lack of productivity growth if we measured free apps this way instead of assuming that they have zero contribution to the economy? And where would equity markets be today if we saw GDP growth that was 0.5% higher each year for the last decade or so?
What gets measured gets done and how it gets measured impacts investment returns.