


Those motherf…

That was my immediate reaction when I finished reading a paper by Maria Borysoff and Gregory Brown about the reported multiples of invested capital by private equity funds. But let me start with listed equity.
It is well known that company executives manage earnings to meet analyst expectations or avoid losses. The chart below is taken from the original article in 1999 that demonstrated this for the first time. Earnings that slightly miss expectations are far less frequent than should be expected by chance as indicated by the black shade below the distribution.
Earnings releases vs. analyst expectations
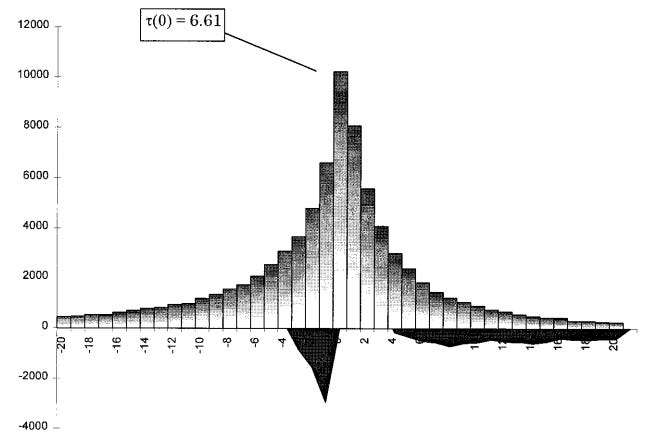
Source: DeGeorge et al. (1999)
This earnings management is done using discretion in when to account for expenses and revenues within the existing accounting rules. But because it typically amounts to shifting costs from one quarter to the next by a few weeks, these distortions reverse quickly. In the long run, earnings are relatively undistorted by such management decisions.
Given that everybody in the listed space does this, it wasn’t a surprise to learn that private equity managers also engage in earnings management. But instead of earnings, they focus on the money multiplier or the multiple of invested capital (MOIC).
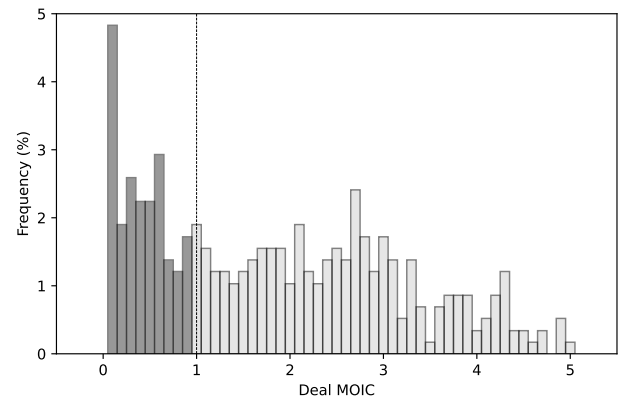
The chart below shows the reported MOIC as reported by private equity funds. One doesn’t need a statistical analysis to see that something is going on for MOICs around 1.0. There are far fewer deals that lose a little bit of money (MOIC slightly below 1.0) than deals that make a small profit (MOIC slightly above 1.0).
Reported MOIC of private equity deals

Source: Borysoff and Brown (2024)
However, the chart above shows only the reported MOICs of completed and exited deals. In comparison, here is the distribution of reported MOICs for deals that are unrealised at the time of reporting. Strangely, there is no jump around a money multiplier of 1.0.
Reported MOIC of unrealised private equity deals
Source: Borysoff and Brown (2024)
OK, nothing too surprising there. My original intuition was that private equity managers are just human, and they tend to avoid losses so they hold on to loss-making deals until a point when they can exit it at a MOIC of 1.0 or slightly above. If the MOIC remains below 1.0, they simply stay invested. That would be the private equity equivalent of the disposition effect.
But what made me perk up was the chart below. This is an analysis of the frequency of the first two digits of the MOIC reported by private equity funds. This frequency should follow Benford’s Law which states that numbers starting with the digit ‘1’ are more frequent than numbers starting with the digit ‘2’, which are in turn more frequent than numbers starting with the digit ‘3’, etc.
This distribution of digits in numbers is often the first step when analysing data for tampering, for example when trying to detect election or scientific fraud. When people try to fudge the numbers, they often don’t pay attention to the statistical distribution of these numbers so manipulated data violates Benford’s Law.
The chart below shows the distribution of the first two digits of the reported MOIC. Dark grey bars are statistically significant deviations from Benford’s Law.
Distribution of first two digits of reported MOICs

Source: Borysoff and Brown (2024)
In particular, the study showed that when a fund is raising money or wants to raise money soon, this deviation is huge. Once a fund is closed for investment it disappears completely.
And this is where I better quote from the paper rather than provide my personal opinion:
“While our analysis provides no evidence of improper or fraudulent behavior by funds, it does suggest that funds may potentially reallocate resources to get small losers to the break-even point.”
That’s all fine, but unlike earnings management by listed companies, these shifts in MOIC do not even out over time. Remember that the deviations only appear for exited deals, which means that these MOICs remain part of the history of the fund forever and never revert. Indeed, the study also concludes that:
“Loss avoidance may provide financial benefits because loss-avoiding GPs raise significantly larger subsequent funds relative to their vintage peers. While loss avoidance may benefit GPs, it is negatively associated with the final fund returns that investors receive.”
For an illustration of the degree of volatility smoothing in Private versus Public Assets see the following small downloadable Excel and VBA demonstration https://www.academia.edu/41838881/Impact_of_Autocorrelation_on_Expected_Maximum_Drawdown
There was another paper of the same vintage which showed that earnings does not match cashflow in the long run. They took (I think) every company which had been in the S&P 500 for the past 10 years, added up earnings & cashflow and divided. Over ten years, they should be the same, right?
Earnings was very very consistently ~1.1x cashflow! GAAP accounting rules allow many small acts of puffery, and every big public company does all of them.
Sorry, I have no idea how to dredge this up as a citation.