I am not breaking new ground when I say that most people are bad at forecasting financial markets. But just how bad they are has been the focus of an analysis by a group of researchers from Washington University. And their results have significant implications for portfolios.
In the US, there are three major surveys of forecasts for US equity market returns over the coming 12 months. These three surveys have a long history of forecasts and can thus be used to test their accuracy:
The Livingstone Survey of professional forecasters conducted every six months by the Federal Reserve Bank of Philadelphia.
The CFO survey by John Graham and Campbell Harvey.
The compilation of different household surveys by Stefan Nagel and Zhengyang Xu.
Three surveys of three groups of people with different financial sophistication. What could possibly go wrong? A lot, as can be seen by a simple stat. None of the surveys even comes close in the long run to forecasting the actual return of equity markets. The long-term average market return is 8.9%, yet the average forecast return is less than half that at 3.8%! The average return of the CFO survey is 4.0% and the average return from the household surveys is 6.7%.
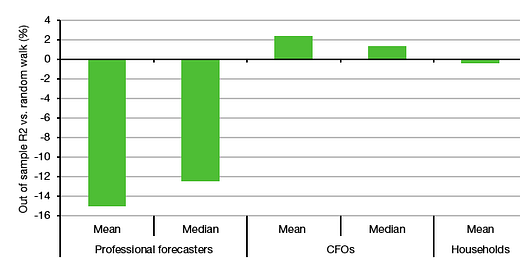
But at least we may get the direction of markets right. Alas, the chart below shows the accuracy of the forecasts vs. a random walk that assumes that next year’s return is simply going to be the same as last year. Turns out that the survey of professional forecasters and private households are worse than a random walk and the CFOs are only marginally better than a random walk at forecasting equity market returns.
Performance of 12-month forecasts vs. random walk
Source: He et al. (2023)
But maybe that little bit of outperformance vs. a random walk is enough to make money? Well, the researchers also created stock/bond portfolios based on the forecasts from the three surveys and compared the resulting performance to a market portfolio. Using the typical mean-variance portfolio optimisation approach today’s second chart shows the Sharpe ratio (i.e. the risk-adjusted return) of the ‘optimised’ portfolios vs. the market portfolio based on historic returns. No matter which forecasts they used, the so-called optimised portfolios were worse than the market portfolio and effectively destroyed returns. There simply is no wisdom of crowds when it comes to forecasting financial markets.
Sharpe ratios of ‘optimised’ portfolios vs. the market
Source: He et al. (2023)
That has serious implications for portfolio construction in general. Instead of trying to develop return forecasts for different asset classes, investors should use robust optimisation methods that either don’t use any explicit return forecasts or are designed to incorporate forecasting errors. The simplest way to do this is to go for equal-weight portfolios, but minimum variance portfolios or more sophisticated methods like resampled efficient frontiers will work as well. What does not work is what most asset managers do at the moment: Trying to forecast long-term returns for asset classes and then putting them into a mean-variance optimiser.


'The Livingston Survey is the oldest continuous survey of economists' expectations. It summarizes the forecasts of economists from industry, government, banking, and academia.'
https://www.philadelphiafed.org/surveys-and-data/real-time-data-research/livingston-survey
O dear...
Reminds me of Philip Tetlock's 'Superforecasters', in which he showed that smart - but not brilliant - nobodies, who have their ego in check, perform better than the 'experts' (i.e. the talking heads on tv).
For this article/study, the smart nobodies would be the CFO's, who at least read (their own) balance sheets, an activity that for many investment analysts has become quite exotic as they preferred to focus on narrative.
On assumption we are equally bad at predicting fund manager outperformance in advance would you advocate equal weighting equity managers here also?