Ever since Liberation Day, many others and I have been saying that the true damage does not come from the tariffs but from the uncertainty created by the constant changes in tariff and fiscal policy. But the quantitative impact of this heightened uncertainty was hard to quantify – until now.
In 2016, when the UK population voted for Brexit, investment activity in the UK and industrial production slowed. That was simply a reflection of the heightened uncertainty about the future relationship between the UK and the EU. Effectively, what Brexit boiled down to was that the British people voted to put a 10% tariff on 50% of their imports. It’s a crude comparison, but in 2016, the UK imposed a roughly 5% tariff on its imports. Today, the US plans to put tariffs of 10% or more on all its imports.
The result was that businesses didn’t know what to plan for, and as a result, reduced their investments in the UK. Goldman Sachs estimated a year ago that, as a result, the UK economy would be 5% smaller in 2024 than it would have been if it had remained in the EU.
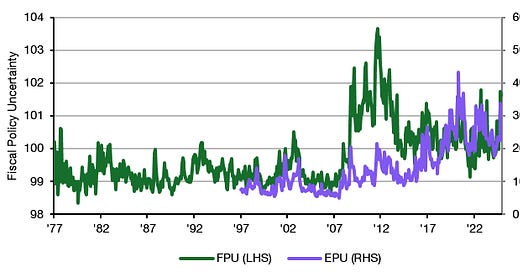
A team from the IMF and Yale University created a global fiscal policy uncertainty index (FPU) based on news reports about fiscal policy uncertainty. They constructed it analogous to the Economic Policy Uncertainty index of Baker, Bloom and Wurgler (EPU), which has become one of the most commonly used charts in my repertoire. But instead of focusing on all kinds of economic events, including economic crises, the Fiscal Policy Uncertainty index zooms in on acts of parliament or a country’s government. The chart below shows that the differences between the FPU and the EPU can be significant.
Fiscal and economic policy uncertainty index
Source: Baker et al. (2016), Hong et al. (2025)
Then, the researchers tried to find out what the result of a one standard deviation increase in the FPU is. Thank goodness, they designed the FPU in such a way that it has a standard deviation of one, so instead of one standard deviation, we can think of a one-point increase in the FPU. A one-point increase in the FPU (similar to the government shutdown in Q2 of 2011) triggers a 0.4% to 0.6% slowdown in US industrial production that lingers for up to 20 months. It also creates a medium-term reduction in the US stock market of c.2% after 30 months. Hence, there is a persistent drag on share prices from a one-point increase in fiscal policy uncertainty.
More importantly for our discussion today, the researchers also find that borrowing costs for the government increase materially for the two years or so following a fiscal policy uncertainty shock. The chart below shows that the excess bond premium the government has to pay when it wants to borrow money tends to increase by about 20 basis points in reaction to a one-point increase in the FPU.
Meanwhile, the yield spread of advanced economies vs. the US rises by some 10 basis points, and the yield spread of emerging markets vs. the US rises by some 40 basis points. We probably can’t generalise the last two results to today, as fiscal policy uncertainty emanates from the US. As a result, bond yields of other advanced economies, such as Germany or Switzerland, have declined, as investors have moved out of US Treasuries. However, in my view, we can use the excess bond premium result as a guide for today.
Impact of a one-point increase in FPU on excess bond premium (left), advanced economy yield spread (middle) and emerging market yield spread (right)
Source: Hong et al. (2025)
A 20-basis-point increase in the borrowing costs for the US government doesn’t sound like much, but be aware that in 2024, the US government paid $889 billion in net interest on $26 trillion of debt (a 3.4% average interest). If interest costs rise by 20 basis points across the board, that will eventually lead to an additional $55 billion per year in interest costs.
And now consider that so far, we were only talking about a one-point increase in fiscal policy uncertainty. This is what we already saw in late 2024 when Donald Trump was elected. We don’t have the index data for 2025, but my guess is it will be similar to what we saw during the financial crisis in 2008 because that is the story that the Economic Policy Uncertainty index tells. In that case, we can expect an increase in the excess bond premium of approximately 60 basis points for the US government and additional interest costs of up to $165 billion per year if these costs persist. And that is about the GDP of a country like Kuwait or Morocco wasted on interest payments.


Incompetence and corruption are really expensive. Too bad the tax payers representatives aren’t demanding action. I’m reading Left Behind by Paul Collier. It’s about developing countries and left behind places and how they can spiral up. Developed rich countries seem too complicated and sophisticated for this analysis, but the foundational power to tax and provide security requires building trust. All the places that fail to spiral up have problems with corruption and an inability to provide a secure predictable environment. The one good thing about the Trump experience is it is forcing us to see what really makes societies strong and resilient.
is the uncertainty effect linear on the equity mkt?
i wish there was a report that would combine uncertainty+soft+hard data to provide greater confidence on mkt trajectory.
because currently, the only appearance is there may be noise-level earnings decline in q3.