I have written before about the observation that factor returns and smart beta funds tend to show much lower returns after a factor has been published in academic journals than before. One of the reasons why the performance of smart beta funds is so weak is that sponsors of these funds try to outfox the original factor and make it more ‘sophisticated’ thus overfitting data to the past.
But there is another effect in place that should make investors worry about factor returns. Once a stock market anomaly has been described in a journal, everybody knows how to replicate it. And because factor portfolios are typically re-adjusted on the first of each month, this means that a lot of money is moving into the stocks that make up factor portfolios on that day – which pushes the price of these stocks higher on the first day of the month and ‘front-loads’ the factor returns. Investors who come in on day 2 of the month have to buy these stocks at elevated prices and face lower returns afterward.
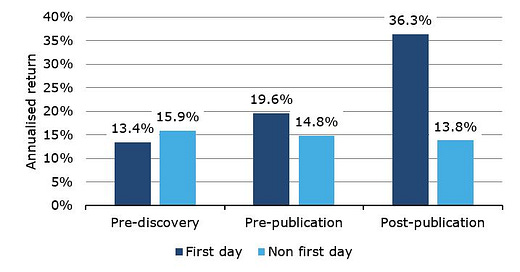
Guy Kaplanski from Bar-Ilan University in Israel has tried to measure this effect and it seems to be quite large. He looked at 71 anomalies described in the finance literature and measures their performance on the first day of the month and the subsequent days. The chart below shows only the long side of the trade split up by the period pre-discovery (which is the time period used in a publication to measure the effect), pre-publication (the time from the end of the measurement period in the publication to the publication date of the article), and post-publication (the time after the research has been published). Note how the return of the anomaly on the first day of the month and in subsequent days is roughly the same before publication. But once a stock market anomaly has been published, the first day of the month sees much stronger returns while the rest of the month sees weaker returns. This also means that if you are a factor investor and you are just one day late in implementing your factor portfolio, you have missed out on most of the returns already.
Return of 71 anomalies in the stock market before and after publication
Source: Kaplanski (2021).
This reminds me of a market development that cost me dearly as an investor when commodity investment became popular in the first decade of the 21st century. Historically, investments in commodity futures were done by investing in futures and rolling them over to the next active contract around the turn of the month. But as commodity investments became more popular, more and more investors did the same thing, thus pushing the prices for expiring future down and bidding up the prices for next month’s future. This created a large negative roll yield that destroyed the returns of conventional commodity investments.
Over time investors reacted to this effect by creating roll-optimised commodity funds that would roll at different times of the month or use more sophisticated rolling methodologies to avoid this effect. Similarly, factor investors can avoid some of the pain from this first day of the month rally by rebalancing and recalculating their portfolios at different times of the month. I re-calculate and rebalance the factor portfolios I publish at work in the second half of each month. This way, my readers have enough time to implement any changes before the first of each month.
Another way to improve factor returns is to slightly alter the way factor portfolios are calculated to change the composition of the factor portfolios vs. the standard factor. But this basically means that you risk creating more sophisticated factors that ore overfit to past returns, i.e. you fall into the trap I have described above. The real art is to find a slight change to factor methodologies that is robust to changes in markets and not overly fit to past returns. And that is very difficult indeed because it means you have to outfox not just the stock market, but all other investors as well.


Hi Joachim, first of all: I really like the content you share and very much appreciate it! I have a question on this article, where (also read Kaplanski) the author Kaplanski tends to discuss the scientific publication of anomalies. In that way we can surely talk about Day 1 (T+1 after publication). Companies mostly have their Q-reporting deadlines at the end of month, so this is also in line with day 1. Practice shows however that the majority of reports (around 75%) is processed in the big financial databases at the 10th of the month. Did you think of this process lag, when selecting the second half of the month to run you data analysis? Aren't you missing out on the accounting variables then, or do you want to make sure 100% of reports is processed? By preloading only 'old' accounting variables, and newer price momentum etc.? A little bit a chicken and the egg story ;)