I have been writing about the outperformance of ‘green’ stocks vs. ‘brown’ stocks a long time ago and by now this green-minus-brown return difference has become widely accepted and is being used by major asset managers. What is interesting, though, is that the focus of this return premium seems to have shifted from regulatory risks to physical risks in the past decade.
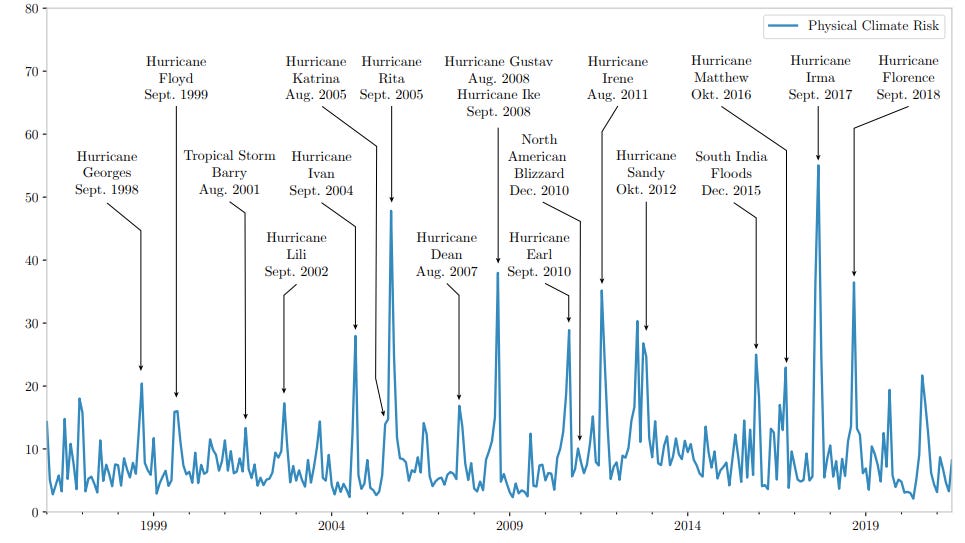
Thomas Dangl and his collaborators did something interesting. They used large language models to measure the news reports and company-specific exposure to climate change related events. Crucially, the language processing allowed them to differentiate between actual physical risks like hurricanes, wildfires, floods, etc., and the risks from regulatory changes and possible climate action as a result of the COP meetings, etc. Below are the time series of physical and regulatory risks in the US.
Physical climate risks
Source: Dangl et al. (2023)
Regulatory climate risks
Source: Dangl et al. (2023)
Thankfully, unlike most academic research, they also provide a list of the companies that are most exposed to these types of risks and a list of the ‘greenest’ and ‘brownest’ US companies with regard to these risk factors. You won’t be surprised to learn that electric and gas utilities are the most exposed to both physical and climate risks or that oil and gas companies are up there in the top five as well. Meanwhile, insurance companies are among the most exposed to physical climate risks but have relatively low regulatory risks. That isn’t a surprise since insurers have to pay up if a hurricane or a flood destroys an area.
Where things may be a bit more surprising is to see food producers among the top five sectors exposed to physical climate risks and in the top 10 sectors exposed to regulatory climate risks. Apparel companies, meanwhile, are among the top ten sectors exposed to physical climate risks and business services are close to the top for both physical and regulatory climate risks.
But looking at physical and regulatory risks separately also provides new insights into how stock markets price climate risks. Crucially, the researchers found that exposure to physical climate risks is associated with a 1.5% risk premium per year (the 20% ‘greenest’ companies outperform the 20% ‘brownest’ companies by that amount). Regulatory climate risks used to carry a similar-sized risk premium of 1.54% per year until about 2011. But it seems starting in 2012 there was a regime shift when markets focused less and less on regulatory risks and more on the actual physical risks. In any case, the risk premium for regulatory risks flipped signs after 2012 and became -2.56% for the decade after that. Hence, when it comes to regulatory risks, it now pays to invest in brown companies with large negative exposure to these risks.
Unfortunately, these companies also tend to have large positive exposure to actual physical risks which still comes with a significant return benefit for green companies. All that is to say that what matters for investors today is less and less what regulators do and more what happens to them in the real world. And that is as it should be, in my view.


