In the first two parts of our discussion of the excellent analysis of stocks and bonds by Edward McQuarrie, we showed that stocks are much riskier in the long run than many investors believe, both in absolute returns and relative to bonds. Whether stocks outperform bonds or vice versa is essentially driven by the market regime and long-term trends in interest rates, economic growth, inflation, etc. These long-term changes in market regimes also influence the volatility of stocks and bonds and the correlation between these two asset classes. And this means that in portfolio construction, we may have to abandon some long-held beliefs.
First, and to me the most important lesson of the first two parts of this series for portfolio construction, if stocks aren’t increasingly likely to outperform bonds in the long run, it means the risk premium on equities is not stable over time. Instead, the equity risk premium over bonds fluctuates and depends on the principal drivers of the economy and financial markets (like interest rates, growth, and inflation). But if that is the case, using longer historical data to determine the equity risk premium or the expected return of stocks and bonds is not going to work. If one uses longer and longer historical data, all one does is increasingly mix one regime with other regimes. The result is a mix that is not predictive of any regime.
Instead, to assess future return prospects for stocks and bonds, investors need to analyse the historical track record conditional on the regime we are going to be in. If we are heading toward a future of low economic growth, what relevance do equity or bond returns in the high-growth era after the Second World War have for today? If we are heading toward a future of non-zero interest rates, what relevance does the experience of the zero-interest rate regime from 2009 to 2021 have? I would argue very little.
If you want to have an additional indication that even in the long run, stock market returns are dependent on the market regime, just take a look at the 10-year return distribution of US stocks in what has become the most-read post I have ever written.
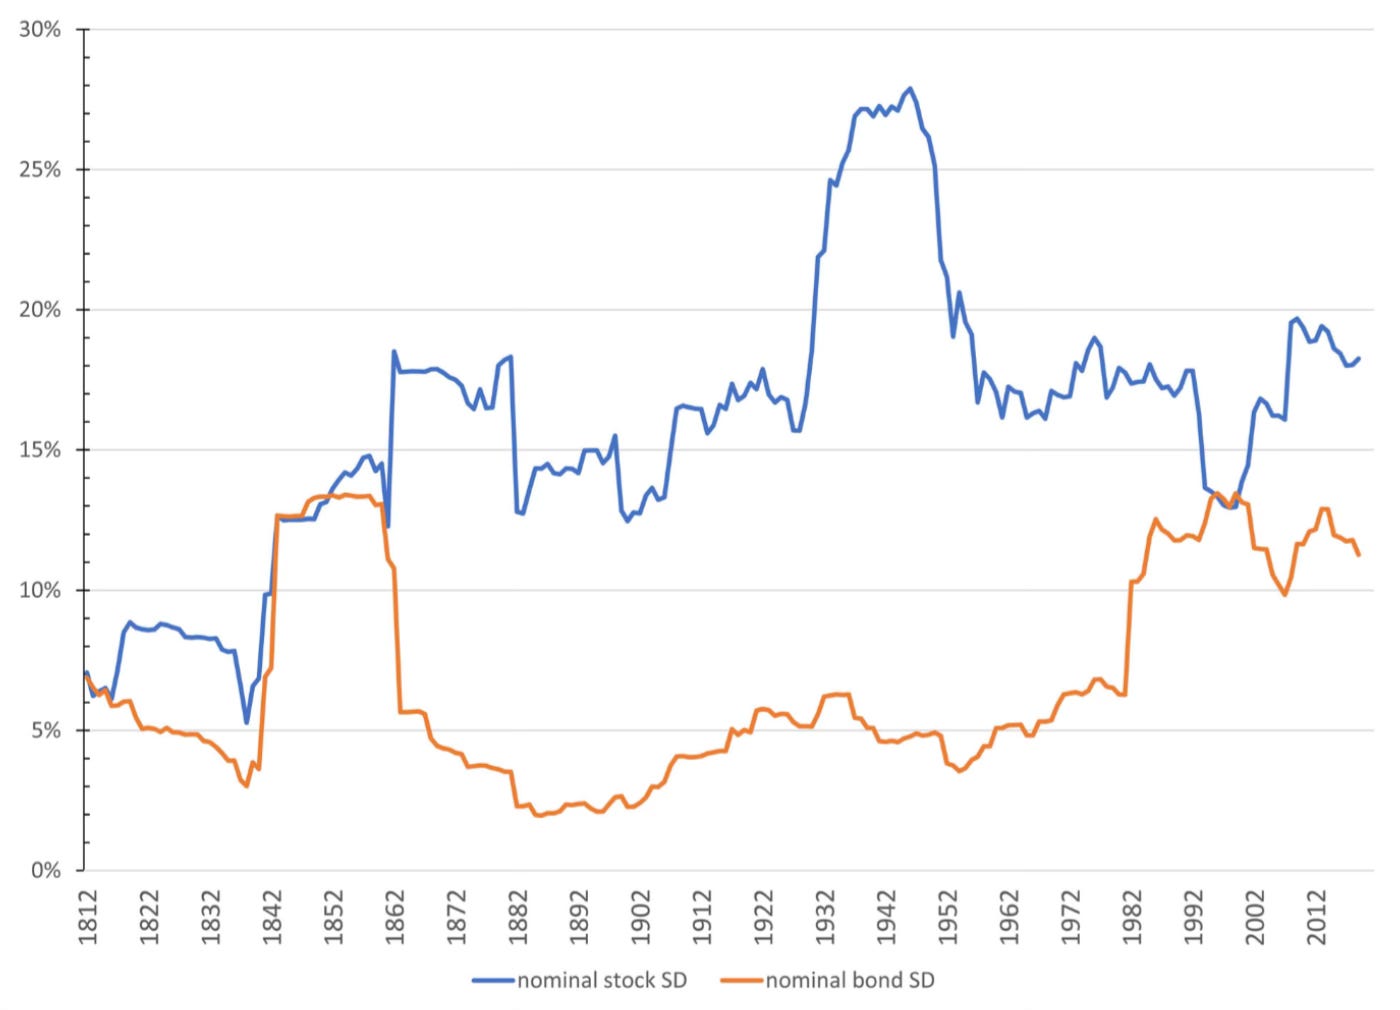
But McQuarrie argues that not only returns are regime-dependent but also volatility and correlation between asset classes. Here is the rolling 20-year volatility of stocks and bonds in the US. Econometrists tend to think of volatility as one of the most stationary finance variables there are. If you have ever studied GARCH models, this stationarity is explicitly built into the model. Yet, the chart below shows that neither stocks nor bonds show stationary volatility.
Long-term average volatility of stocks and bonds
Source: McQuarrie (2023)
The volatility of bonds since the great disinflationary trend started in the early 1980s is larger than in the hundred years before. Systematically declining inflation and interest rates meant that bond yields dropped. However, because the volatility of interest rates remained largely unchanged, fluctuations in interest rates had an increasing impact on bond prices. The result is rising bond market volatility from the 1980s to the 2010s.
Is bond market volatility going to remain that high? If we are entering a period of rising interest rates (something I do not expect, see here) then one would expect bond volatility to gradually decline in the coming decades. If, on the other hand, the current elevated interest rate level is temporary, then one would expect bond volatility to stay high.
Stock market volatility is also slightly elevated compared to past periods. It is not as elevated as in the aftermath of the Great Depression, but much higher than in the 19th century or the 1990s. Again, I would argue that as GDP growth has trended lower, the volatility of GDP growth has not declined by much (there was no great moderation, as we found out in 2008). The result is that while trend growth for corporate earnings has declined, the volatility of earnings has not changed by much. The result is that the swings in stock market prices have become somewhat larger than in the past.
But as long as stocks and bonds have a negative correlation, we can at last reduce this higher volatility in a mixed stock/bond portfolio. And bonds have a negative correlation with stocks, don’t they? Don’t they? …please tell me that stocks and bonds have a negative correlation in the long run because that is the foundation of stock/bond portfolios recommended by asset managers and banks everywhere.
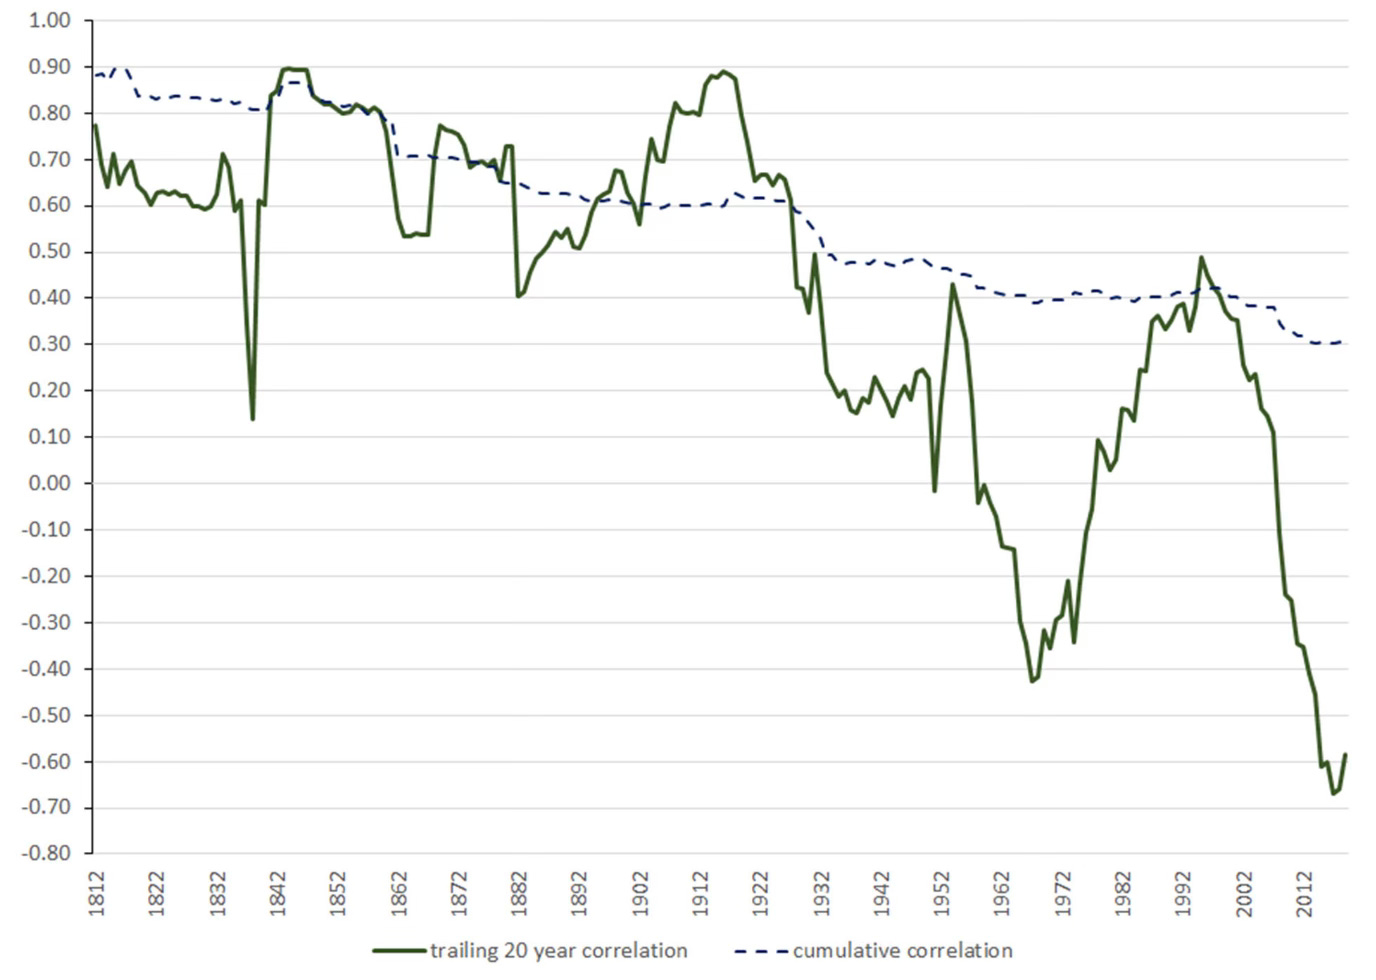
Ahem, let me introduce you to the chart of the long-term correlation between stocks and bonds.
Long-term correlation of stocks and bonds
Source: McQuarrie (2023)
Since the 1960s, the correlation between stocks and bonds has been either very low or even negative. This is the time when modern portfolio theory was born and when stock/bond portfolios became the workhorse benchmark against which to assess all other investment approaches.
But before the 1960s, the correlation between stocks and bonds was on average 0.5 to 0.6, much higher than any investor today expects it to be going forward. If the correlation between stocks and bonds is that high, the diversification benefits from investing in stocks and bonds are much smaller as these two asset classes increasingly move in lockstep.
Note that even since the 1960s there have been large swings in the 20-year correlation between the two asset classes. Notably, in the 1970s the correlation increased, before falling again in the 1990s.
Once again, this is driven by regime changes. In the 1970s, we faced a regime of high and rising inflation. As investors were reminded in the last couple of years, stocks are NOT an inflation hedge, at least not once inflation surpasses 4%. For low to moderate inflation, stocks do fine and provide an indirect hedge against inflation, but once inflation becomes so high that companies can’t pass on higher input prices to end customers fast enough, earnings growth drops quickly, and stocks tank. The result is that in times of high inflation, the correlation between stocks and bonds moves into high positive territory.
In the disinflationary period starting in the 1980s, we saw the opposite. Lower inflation boosted both bond prices but also corporate earnings growth. In this environment, inflation is less and less of an important driver of stock market returns and swings in GDP growth become more important. Hence, earnings growth is primarily driven by GDP growth. And if GDP growth slows down, central banks cut interest rates to boost demand. The result is that when earnings growth slows down, bonds rally, creating a negative correlation between stocks and bonds.
What then, do we have to expect for the correlation between stocks and bonds going forward? I would argue that once again, this depends on what you expect for GDP growth, inflation, and interest rates. If you expect inflation to remain high and possibly trend higher going forward as it did in the 1970s, you should expect the correlation between stocks and bonds to remain positive, possibly 0.5 and higher. If on the other hand, you expect inflation and interest rates to subside again, you should expect a significantly negative correlation between stocks and bonds.
Depending on the regime you expect and the assumptions on correlation you make, the allocation to stocks and bonds will be very different going forward. In a world of high correlation between stocks and bonds, the allocation to bonds will likely be smaller, unless you also expect the equity risk premium to be smaller (which again depends on your expectations for growth, inflation, etc.). In a world of negative correlation between stocks and bonds, the allocation to bonds will be higher, unless you expect the equity risk premium to be larger.
And so, this argument goes on and on, demonstrating one thing: The way we have done portfolio construction in the past is inherently flawed and leads to suboptimal outcomes. We need to become serious about how asset prices are linked with each other and how these relationships change in different regimes. And then we must build portfolios for the regime we are in, not some long-term average that doesn’t exist anyway.


I have written a brief summary of the Common pitfalls and fallacies in financial data analysis, applied precisely to the examples discussed.
https://themarketjourney.substack.com/p/dont-always-trust-regression-and
Anyway, I am increasingly amazed by your ability to write enlightening articles every day.
A new test should be created: The Klement test, a sort of Turing test.
If AI can create a blog and match the quality of “Klement on Investing”, then it means we have reached definitive AGI (Artificial General Intelligence).
Good evening sir. When you write: "if you have ever studied GARCH models, this stationarity is explicitly built into the model. Yet, the chart below shows that neither stocks nor bonds show stationary volatility", you confront GARCH volatility to rolling volatility. This is not a homogeneus comparison (garch volatility is conditional to a specific time interval and produced by a well defined parametric model, while rolling vol is an average stand deviation over a given time window). Besides, your sentence seems to claim Garch models are intrinsically stationary: but this is not nnecessarily the case are, just think about the Integrated GARCH model (although we could disvuss long about the difficulty to efficiently test the presence of a unitary root in a variance process). However, going beyond these econometric technicalities, what is more striking to me is that you seem to consider the rolling volatility a "better" estimator of the true, by default unknown, volatility being this claim hardly supported by statistical test and empirical assessment). I believe the confusion arises from tha fact that non stationarity is not the same thing as time-varying: in fact, volatility and correlation can definitely change over time without being non stationary, and this actually is the most important feature of stationary garch models. Therefore, imho, the conlusions drawn aboit thiss issue in your eccellente artiche are correct (vol/correl absolutely are not stabile over time), but they are not demonstrated by the chart you show. Sincerely, Valerio P.S. this econometric clarification, as I've already stressed, does not change my judgement about the contents of your analysis, which I fully support and appreciate