Note: This article was originally posted on the CFA Institute Enterprising Investor blog on 30 June 2020.
One of the things researchers in economics and finance always get asked first is: “But is it significant?” This is an interesting contrast to: “Does it matter?”
Probably the book that every economist, research analyst, and investor needs to read but very few actually have is The Cult of Statistical Significance by Stephen Ziliak and Deirdre McCloskey. In it, they describe how the entire field of economics and finance has become enthralled by p-values. If a result is statistically significant at the 5% level, it is considered to be a valid phenomenon, while results that fail that test are supposed to be non-existent.
Obviously, that misses two points. First, by chance alone one in every 20 experiments or tests should be statistically significant at the 5% level by chance alone. Given that there are thousands and maybe millions of tests done with finance and economics data every year, you can imagine how many spuriously positive results are found and then published (because we all know that publishing a positive result is way easier than publishing a negative result).
I remember that during my university days, I was sitting in a seminar where a researcher presented statistically significant evidence that directors of companies leave the board before a company gets into trouble with their auditors or regulators. That’s all fine and well until he showed towards the end of the seminar that this observation can make you money. A full 0.2% outperformance per year – before transaction costs.
Because the researcher had so many data points to estimate his regression, he could generate statistical significance even though there was definitely no economic significance to the effect. In the end, it was a purely academic exercise.
In the 21st century, the availability of data has multiplied and hedge funds as well as traditional asset managers use big data to find patterns in markets that can be exploited. And increasingly, AI is used to analyse the data to find “meaningful” correlations that cannot be identified with traditional analyses. I have written before that this approach to investing has a lot of challenges to overcome.
One major challenge that often isn’t even mentioned is that it becomes more and more likely to find statistically significant effects the more data you look at. Statistical tests become more powerful the more underlying data one has. What that means is that with more data, smaller and smaller effects can be detected, that may or may not be economically meaningful.
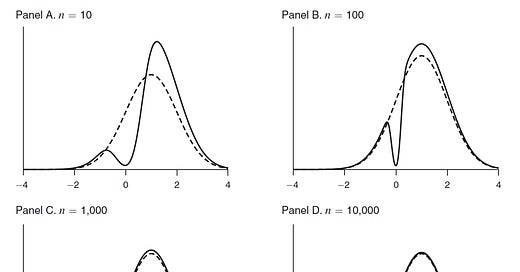
The chart below is taken from a paper that analyses how much knowledge we gain with a statistically significant test result. The dashed curve shows the assumption of the possible distribution of a variable before any tests are done. Then, one measures the data (e.g. stock returns of stocks with specific characteristics) and ends up with a statistically significant result. The solid curve in the chart below shows where the true effect could be depending on the number of data points. With very few data points a statistically significant result carves out quite a big junk of the distribution, so we know a lot more if we get a significant result with few data points. But with 10,000 data points, the carve-out is extremely small. In other words, the more data we have, the less informative a statistically significant result becomes. On the other hand, if we would see a failure of statistical significance with a test on 10,000 data points, we would learn an awful lot. In fact, we would know that the true value would have to be almost exactly zero. And that in itself could give rise to an extremely powerful investment strategy.
The impact of a statistically significant result on your knowledge

Source: Abadie (2020).
In my view, this is one of the major reasons why so many applications of big data and AI fail in real life and why so many equity factors stop working once they have been described in the academic literature. In fact, a stricter definition of significance that accounts for possible data mining bias has shown that out of the hundreds of equity factors only three are above suspicion from p-hacking and data mining: the value factor, momentum, and a really esoteric factor that I still haven’t understood properly myself.


I love this. Thing is it's not only in economics. Imagine genetics were you run a lot of tests and there is a lot of data. Good science is very hard and the incentive is to produce irrelevant of good or bad. There are already many stories about all the terrible Covid-19 related science.
Here is a discussion about Physics: https://twitter.com/david_colquhoun/status/1280963340144185344?s=20
the running joke is that Peter Higgs (Higgs Bozon)would not have made it in the current environment.
That's the performance aspect. Add to that the whole political correctness thing at the university and doing good science becomes even harder.
Sadly Statistics is a great tool that very often gets abused.
Thanks for sharing that Abadie paper.