Maybe it is because I am German, but I am fascinated by the decline in productivity growth in Europe and North America. In the past, I have written about the decline in research productivity and the reduced capital investment in workers. Now, a new study has tried to assess the relative importance of these and other factors in a range of countries.
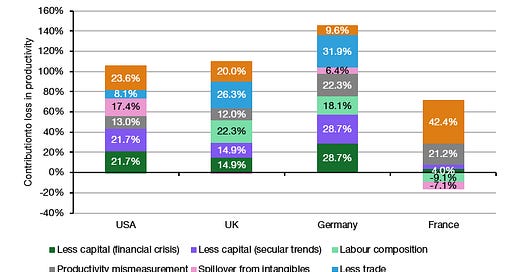
The research of Ian Goldin and his colleagues from Oxford University is a veritable tour de force to assessing what could drive labour productivity. Every bit of detail is examined carefully and teased apart from the other potential influences. In the end, they often can explain more than 100% of the observed drop in labour productivity between 2005 and 2017, which means that there may be some other factors that have increased productivity somewhat. My chart shows the results for the US, the UK, Germany, and France in comparison.
Contribution to labour productivity decline 2005-2017
Source: Goldin et al. (2024)
A couple of things stand out:
The loss of capital investments in productivity-enhancing technologies as well as worker education and training is the dominant driver in most countries. It explains c.43% of the productivity decline in the US, c.30% in the UK and a large 57.4% in Germany. They estimate that about half of this decline is due to the lack of access to capital and the lack of investment during and after the financial crisis and the other half is driven by secular trends.
The changing labour composition from an ageing population was a major driving force in the UK and Germany.
Fewer benefits from international trade accounted for about a quarter of the productivity decline in the UK and close to a third in Germany. This is a result of these countries either having less access to the most productive technologies or being replaced by other countries in global value chains and thus losing the incentive to invest.
Finally, there is about 10% to 20% of the productivity decline that is likely due to measurement errors and the inherent difficulties in determining what constitutes productivity growth.
Which brings me to the last component, labelled ‘Misallocation of resources’ in the chart.
This is the second most important driver for productivity decline in the US and the most important one in France. But even in the UK, it explains about 20% of the observed productivity decline. This sounds like businesses are not putting the right people to work in the right places, but it is more complicated than that. In effect, this is a combination of several factors, all of which reduce competition and introduce market friction.
First, there is the misallocation of human resources. This is the result of some industries paying more than others and people going where they can make the most money with their talents, even if these industries have small productivity growth. To put it bluntly, this reflects that people prefer to work in finance, law, and consulting (three sectors with low productivity growth) rather than engineering and technology.
Second, there is the trend toward less competitive markets and large businesses building moats around their products and services and stifling competition. This is the most important driver for the misallocation of capital in the US and UK where the largest companies have managed to remove a lot of their competition and now can earn huge profits without the need to innovate or increase productivity. The US tech space is no longer a competitive market because if it were, companies like Microsoft, Meta, or Apple couldn’t keep the operating margins they have right now – and indeed had for more than a decade.
And finally, the misallocation of capital results from the persistent decline in bankruptcies and creative destruction. I disagree with Austrian economics on almost everything, but there is a lot of truth in the power of creative destruction. Yet, the rate of firm exits and startup creation alike has declined in the US and most developed countries. Where zombie companies are allowed to continue operating, many resources are wasted, and employees remain in jobs with low productivity growth. And where there are fewer startups, there are fewer highly productive new jobs created.
Americans like to emphasise how efficient their economy is. Yet, it is precisely their economy that is more wasteful and less efficient than most. Among the countries examined in this research, only France wastes more resources through misallocation.
'Fewer benefits from international trade accounted for about a quarter of the productivity decline in the UK and close to a third in Germany'
Andy Haldane had a lot to say about UK productivity in this presentation: 'LSE Events | Andrew G Haldane | The Productivity Puzzle' (Youtube). Transcript: https://www.bis.org/review/r170322b.pdf
One of his points - 10% of zombies will go bust if interest rates rise to 4% - hasn't played out that way. Covid and gov's responses have had a lot of impact. UK bankruptcies are rising since 2022 but they're nowhere near the pre covid era: https://tinyurl.com/6y9xv7np
4 key Haldane points:
- Lack of exposure to foreign competitors (you being over there or them being active in your country) sees productivity decline;
- Organizational size impacts innovation and thus productivity;
- In the UK catchng up by lagging companies has slowed since the 80s;
- The rate with which productive innovations spread from the core to the perifery has declined.
(I support my memory by taking notes so i 'll post all of his key ideas/finds at the bottom of my, traditionally very short, comment)
'Finally, there is about 10% to 20% of the productivity decline that is likely due to measurement errors and the inherent difficulties in determining what constitutes productivity growth'
The productivity effect of the introduction at scale of IT in the 1990s has been measered in the US - but only a bit. Nothing in Europe. Now are new technologes always adopted slower in Europe - lower risk tolerance - but i guess for both areas difficultiy in measuring also plays a role. But, as IT was introduced the US has seen immigration at levels almost equalling 19th centruy highs, and Europe opened up to eastern Europe and then to the rest of the world. It added between 35 and 40 non EU immigrants since the 90s.
So productivity growth from wage suppression must be factored in. But for particular industries like automotive, manufacturing and pharma (per a 2019 McKinsey study https://tinyurl.com/45t9fyp7. In total about 11% of US labor's loss of share of income can be attributed to globalization. But many studies looking at that subject end with 'we should study some more'...)
'the misallocation of capital results from the persistent decline in bankruptcies and creative destruction'
QE + Low Interest rates = more zombies and at the same time more cheap capital for funky startups that add nothing but hyperbole.
Here's Scott Brinker's annual marketing-tech landscape evolution in two years & two graphs (if you have experience with startup websites i.e. with figuriing out what the hell they actually do and sell...Envision buyer a buyer here):
2014 https://chiefmartec.com/2014/01/marketing-technology-landscape-supergraphic-2014/
'It represents a whopping 947 different companies that provide software for marketers, organized into 43 categories across 6 major classes'
2023 https://chiefmartec.com/2023/05/2023-marketing-technology-landscape-supergraphic-11038-solutions-searchable-on-martechmap-com/
'It now contains 11,038 solutions — an 11% increase from the 9,932 we charted last year.'
And these are the SaaS startups that survived...And it's just the tech for marketing & sales...
Btw: I wanted to see the aging dfference between the UK and De, since i recollected that DE numbers must be worse. But put 'European' in a Google search for recent aging numbers - 'European countries by aging' - and the UK isn't pulled up. Turkey is, so are Moldova, Norway...I had to scroll down to a Wiki for a guick glance at a chart. Fertility rate UK = 1.68, DE = 1.58.
Andy Haldane's points:
Digest of some of his points:
'The UK is 28th for road-quality, spends not a lot on r&d and financial literacy is low compared to other countries.
Organisation size impacts innovation. The UK has many small companies who often can’t improve. But there is an upper tail of SMBs who are very productive. And typically, small organisations grow productivity faster than enterprises.
Since the 80’s the pace of catching up by laggards has slowed.
‘Frontier’ orgs i.e. the most productive/innovative have maintained productivity growth, so secular innovation is continuing there. But secular stagnation exists for a third to a half of orgs where productivity has stood still over the past 2 decades.
The decline in productivity diffusion i.e. the rate and impact with which it spreads from frontier orgs to core- and lagging orgs is the reason for the difference in productivity distribution along the measured orgs.
Does the quality of management contribute to the UK’s lag in prod? Yes, has LSE research shown. A 1 standard deviation in management competence raises UK productivity by ten%.
Organisations that export perform better because they’re exposed to efficient foreign competitors. On average they are a third more productive. The more they export the more productive they are. Raise export by 10% and that will boost productivity by 3%.
Organisations that are foreign owned perform better, and are fully twice as productive as non-foreign owned. They are more likely to be integrated in international supply chains and are being exposed to strong competitors.
Organisation size impacts innovation. The UK has many small companies who often can’t improve. But there is an upper tail of SMBs who are very productive.
A 4% rise in interest rates would cause 10% of highly leveraged orgs to go bust. Most are zombies but gazelles are also there. This scenario would lead to a prod increase of 1,2%.
Employment would lower by 5%. This scenario doesn't have Aldane's preference.
To improve UK productivity one should not want to create the next Tesla but rather raise productivity for the bulk of orgs by a bit: focusing on small incrementals for 75% of all orgs would boost productivity by 13% and elevate the UK to FR and DE levels.
Immigration is also a factor (low skill immigration to the UK decreases investments in technology). And since 2008 workers have moved less between jobs so ideas and innovation don't spread as rapidly as in the past.
R&D: Publicly owned orgs tend to invest less than privately owned, usually 2/2,5 times less than private orgs. Publics pay dividends and execs and that is at the expense of r&d. Haldane would like to see more corp governance so that orgs are measured on their long term investments.'
First of all thanks for your newsletter. Top!
Regarding productivity I often think about the missed opportunities, considering all the tech driven productivity tools that have been made available over the years. Excel, Word, email, video conferencing, the list goes on. A lot of this goes to waste because we have added unnecessary and wasteful activities and lots of extra red tape. Imagine doing what we did 50 years ago with the help of today’s tools …. What a productivity explosion …