The Virtuous Investor: Rule 9
Always be prepared for a fight – don’t let a calm world lull you in
This post is part of a series on The Virtuous Investor. For an overview of the series and links to the other parts, click here.
“As expert captains are wont to cause, when all things are quit, at rest and at peace, that the watch nevertheless be duly kept.”
Erasmus of Rotterdam
In another blog post, I have told the story about a taxi ride I had where the driver told us that in his experience the most dangerous time to drive is Saturday, when the sun is shining and it’s a school holiday. Why? Because that is when people let their guard down, become less alert and more prone to cause an accident. In a rainstorm, on the other hand, people know it is dangerous to dive so they are more alert and watch out for any sign of danger on the road.
The same thing tends to be true in financial markets. On 20 November 2006, the VIX, the so-called fear gauge of the US stock market, dropped below 10 points for the first time ever. And since the VIX measures implied one-month volatility for options on the S&P 500 this means that investors on average expected the volatility of the index to be below 10% over the coming month. Back then, nobody was talking about hedging portfolios against a potential crisis and hardly anyone was investing in absolute return products that promised to limit losses in a bear market. Absolute return products only became fashionable in the aftermath of the financial crisis when investors were so shocked by the recent events that they wanted to buy protection for the next crisis. Of course, today, ten years into a strong bull market, absolute return products have become unfashionable once again since they have been unable to keep up with the strong returns of stock markets.
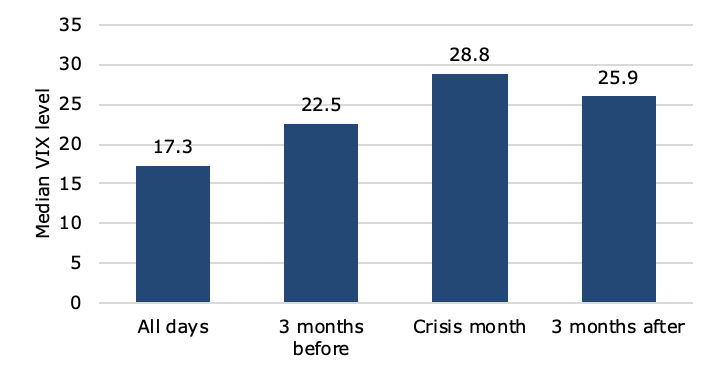
In the chart below I have gone through the daily levels of the VIX since its inception in 1990 and looked at events with the 5% highest levels of the fear index. In order to avoid double-counting extended events like the financial crisis of 2008, I have enforced a blackout period of three months before a new event was counted. This means that if the VIX spikes into the top 5% of its historic range (no forward looking bias), I wait at least three months before I count another VIX spike as a new crisis.
If we look at the three bars on the right of this chart we can see a clear pattern that the median level of the VIX in the three months before the crisis tends to be quite low, then the VIX spikes and in the three months after the crisis, the level of the VIX remains elevated. This is a reflection of investors fighting the last war. They remain concerned about the last crisis until the memory of it fades and option-implied volatility declines again to more normal levels.
VIX levels before and after a crisis

Source: Bloomberg
But looking at the left bar of the chart which shows the median level of the VIX over its entire history shows something else: In the runup to a crisis, the VIX was already somewhat elevated. So, the VIX was signalling some concern in markets but many investors were lulled in by low market volatility that they did not notice or did not react to these early warning signs.
In an unpublished paper, I have looked in detail at the relationship between the VIX and the return of the S&P 500 in subsequent months. If you want a copy, feel free to email me and I will send you a pdf.
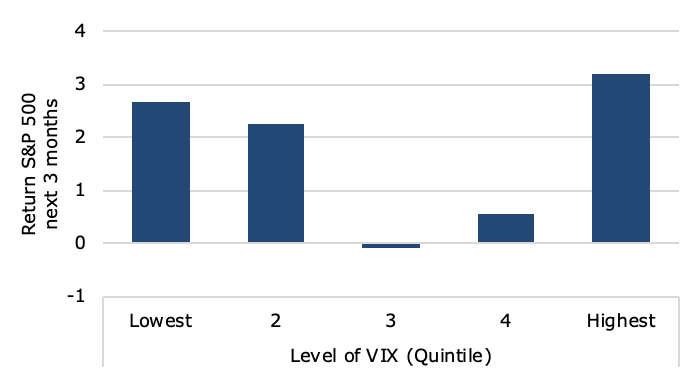
Below is a chart from the paper that shows the average return of the S&P 500 over three months depending on the level of the VIX at the beginning of the three-month period. I have grouped the VIX level into five equal quintiles. The quintile with the lowest VIX levels covers VIX levels up to 13, the second quintile covers VIX levels between 13 and 15.8, then from 15.8 to 19.3 for the middle quintile, 19.3 to 24 for the fourth quintile and levels above 24 for the highest quintile. The interesting observation is that the return of the S&P 500 is high when VIX levels are very low. When markets are calm, they tend to remain calm for a long time. This is why investors get lulled in so easily by calm markets. It is only when calm markets give way to more choppy behaviour that expected stock market returns tend to become negative. And of course, once the crisis hit, then it is too late and stock expected stock market return become very high again because nothing is better for markets than a crisis settling down again.
Stock market return based on starting level of VIX

Source: Bloomberg
This behavioural lull can be exploited by investors. Because market crises usually don’t come out of the blue but have early warnings signs, a good strategy for investors can be to monitor the VIX level and look when it rises from very low levels to more average or slightly elevated levels. In those circumstances, there often still is enough time to reduce risk in a portfolio or hedge risks at a reasonably low cost. Of course, the crisis may never come, and markets may calm down again, but that will just create an even more intensive lull that makes the next crisis more dangerous.
Stock market return based on VIX movement

Source: Bloomberg
PS: The current level of the VIX is in the second quintile of its historic distribution so no warning signs there. However, we had a crossover from the third to fourth quintile in late August, which indicates that the next two to three months are likely to be quite volatile for stock markets.


